ece31645-sup-0001
advertisement
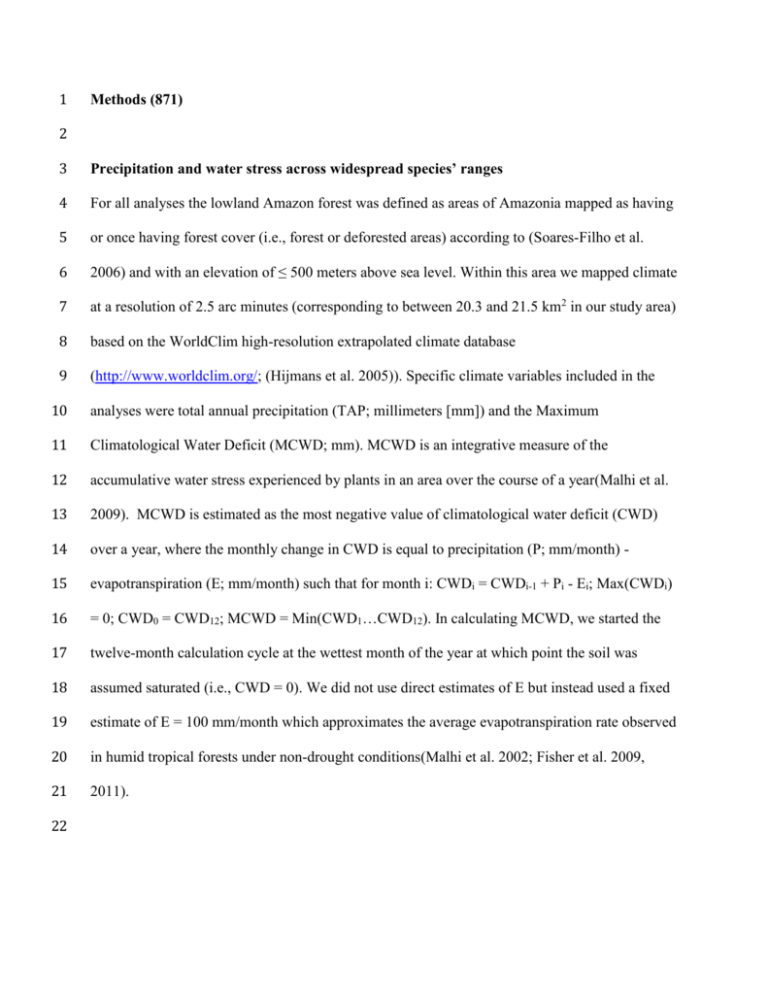
1 Methods (871) 2 3 Precipitation and water stress across widespread species’ ranges 4 For all analyses the lowland Amazon forest was defined as areas of Amazonia mapped as having 5 or once having forest cover (i.e., forest or deforested areas) according to (Soares-Filho et al. 6 2006) and with an elevation of ≤ 500 meters above sea level. Within this area we mapped climate 7 at a resolution of 2.5 arc minutes (corresponding to between 20.3 and 21.5 km2 in our study area) 8 based on the WorldClim high-resolution extrapolated climate database 9 (http://www.worldclim.org/; (Hijmans et al. 2005)). Specific climate variables included in the 10 analyses were total annual precipitation (TAP; millimeters [mm]) and the Maximum 11 Climatological Water Deficit (MCWD; mm). MCWD is an integrative measure of the 12 accumulative water stress experienced by plants in an area over the course of a year(Malhi et al. 13 2009). MCWD is estimated as the most negative value of climatological water deficit (CWD) 14 over a year, where the monthly change in CWD is equal to precipitation (P; mm/month) - 15 evapotranspiration (E; mm/month) such that for month i: CWDi = CWDi-1 + Pi - Ei; Max(CWDi) 16 = 0; CWD0 = CWD12; MCWD = Min(CWD1…CWD12). In calculating MCWD, we started the 17 twelve-month calculation cycle at the wettest month of the year at which point the soil was 18 assumed saturated (i.e., CWD = 0). We did not use direct estimates of E but instead used a fixed 19 estimate of E = 100 mm/month which approximates the average evapotranspiration rate observed 20 in humid tropical forests under non-drought conditions(Malhi et al. 2002; Fisher et al. 2009, 21 2011). 22 23 In order to look at the distribution of climatic variables within the geographic distributions of 24 species, we used the Amazonian plant species range maps of (Feeley et al. 2012) downloaded 25 through the Map of Life (http://map.mol.org/). Within the mapped ranges of 2157 plant species 26 with range sizes estimated as ≥300,000 km2, we extracted all MCWD values and calculated the 27 range of MCWD values across the species full range [Max(MCWD) - Min(MCWD)]. The 28 distributional range area cutoff of 300,000 km2 is the approximate median range size of 29 Amazonian tree species(Feeley & Silman 2009; ter Steege et al. 2013) and was used to 30 distinguish widespread from small-ranged species. We excluded species with smaller range sizes 31 since they may be habitat specialists, which by definition are less likely to have populations 32 locally adapted to different hydrologic regimes. We assume that species with distributions 33 spanning broader ranges of MCWD (i.e. higher values in Fig 2a) have a greater potential for 34 local adaptations to moisture conditions. 35 36 To determine the relationship between differences in MCWD and geographic distances we 37 extracted MCWD values at 1,278 regularly-spaced points (points located at the center of each 38 degree latitude/longitude) within the lowland Amazon forest. For all possible pairs of points 39 (203,841 unique point combinations) we then calculated the absolute difference in MCWD and 40 the straight-line geographic distance, and finally estimated the running median of differences in 41 MCWD within a moving window of 200 km distance. 42 43 Deforestation and future climate analogs across the Amazon 44 We used climate analogs as a proxy for the current and future distribution of locally adapted 45 populations for a given species. We assumed locally adapted populations will track suitable 46 climates as they shift in space due to climate change. 47 48 We began by mapping current TAP and MCWD values within the Amazon at a resolution of 2.5 49 arc minutes based on the WorldClim high-resolution extrapolated climate database 50 (http://www.worldclim.org/; (Hijmans et al. 2005)). We then overlaid areas that were mapped as 51 being deforested as of 2002 and in areas that are predicted to be deforested by 2050 under a 52 spatially explicit model of deforestation assuming Business-As-Usual (BAU) rates and 53 constraints(Soares-Filho et al. 2006). 54 55 To show how deforestation in the southern Amazon could hinder a species ability to adapt to 56 future climate, we mapped future climate analogs under the 2002 and 2050 BAU deforestation 57 scenario. Future monthly precipitation for the lowland Amazon was estimated based on six 58 leading General Circulation Models (GCMs): NCAR_CCSM4, GFDL_CM3, 59 CSIRO_ACCESS1.0, MOHC_HADGEM2, IPSL_CM5A_LR, and MIROC_MIROC5. Future 60 projections were for the 2070s under the RCP8.5 emissions scenario. All models were 61 downscaled to a resolution of 2.5 arc minute based on statistical downscaling downloaded from 62 the International Centre for Tropical Agriculture (CIAT) and the CGIAR Research Program on 63 Climate Change, Agriculture and Food Security (CCAFS; http://www.ccafs-climate.org/). 64 65 Using the projected monthly precipitation values, we calculated the future TAP and MCWD 66 predicted for each grid cell under each of the individual GCMs. Using the future climate (TAP 67 and MCWD) predictions, we then identified and tallied the areas within the lowland Amazon 68 forest that have analogous current climates. Climate analogs were not allowed to occur outside 69 the current boundaries of the Amazon forest as defined above. When identifying climate analogs, 70 we allowed for a difference of ≤ ± 10% in both TAP and MCWD. We then calculated the relative 71 reduction (% decrease) in the number of current climate analogs corresponding to each cell’s 72 future climate due to the loss of area under current (2002) and predicted future (2050 BAU) 73 deforestation. To generate an ensemble prediction, we calculated the median reduction in climate 74 analogs available to each cell due to current and future deforestation across the six individual 75 GCMs (individual model values can be found in Supp Fig1). 76 77 78 References 79 80 Feeley, K. J., and M. R. Silman. 2009. Extinction risks of Amazonian plant species. Proceedings of the National Academy of Sciences 106:12382–12387. 81 82 83 84 Feeley, K., Y. Malhi, P. Zelazowski, and M. Silman. 2012. The relative importance of deforestation, precipitation change, and temperature sensitivity in determining the future distributions and diversity of Amazonian plant species. Global Change Biology 18:2636–2647. 85 86 Fisher, J. B. et al. 2009. The land-atmosphere water flux in the tropics. Global Change Biology 15:2694–2714. 87 88 89 Fisher, J. B., R. J. Whittaker, and Y. Malhi. 2011. ET come home: potential evapotranspiration in geographical ecology. Global Ecology and Biogeography 20:1– 18. 90 91 92 Hijmans, R. J., S. E. Cameron, J. L. Parra, P. G. Jones, and A. Jarvis. 2005. Very high resolution interpolated climate surfaces for global land areas. International Journal of Climatology 25:1965–1978. John Wiley & Sons, Ltd. 93 94 95 96 Malhi, Y., L. E. O. C. Aragão, D. Galbraith, C. Huntingford, R. Fisher, P. Zelazowski, S. Sitch, C. McSweeney, and P. Meir. 2009. Exploring the likelihood and mechanism of a climatechange-induced dieback of the Amazon rainforest. Proceedings of the National Academy of Sciences 106:20610–20615. 97 98 99 Malhi, Y., E. Pegoraro, A. Nobre, M. G. P. Pereira, J. Grace, A. Culf, and R. Clement. 2002. Energy and water dynamics of a central Amazonian rain forest. Journal of Geophysical Research 107:8061. 100 101 102 Soares-Filho, B. S., D. C. Nepstad, L. M. Curran, G. C. Cerqueira, R. A. Garcia, C. A. Ramos, E. Voll, A. McDonald, P. Lefebvre, and P. Schlesinger. 2006. Modelling conservation in the Amazon basin. Nature 440:520–523. 103 Ter Steege, H. et al. 2013. Hyperdominance in the Amazonian tree flora. Science 342:6156. 104 105 106 Fig S1: The percent reduction in number of potential future climate analog source populations in 107 Amazonia under 2070 climate projections accounting for climate analogs lost due to 108 deforestation as of 2002 and under future BAU deforestation for 2050. Black represents a 100% 109 reduction in available climate analogs based on losses from deforestation and the introduction of 110 novel climates. Climate projections were based on 6 leading General Circulation Models 111 (GCMs) and paired maps represent reduction in number of potential future climate analog source 112 populations accounting for loss due to deforestation as of 2002 and 2050, respectively: 113 NCAR_CCSM4 (a,b), GFDL_CM3 (c,d), CSIRO_ACCESS1.0 (e,f), MOHC_HADGEM2 (g,h), 114 IPSL_CM5A_LR (i,j), and MIROC_MIROC5 (k,l), and the RCP8.5 emissions scenario. 115 116 117 10 (a) 10 (b) 10 (g) 10010 (h) 80 0 80 80 0 100 60 100 60 60 80 40 0 80 40 40 60 20 20 40 0 0 60 -10 20 -10 40 0 -10 -10 20 20 -20 -20 0 -20 10 -75 -70 -65 -60 -55 -50 -45 -75 -70 -65 -60 -55 -50 (c) 10 0 -20 -45 10 (i) 100 10 80 0 -75 -70 -65 -60 -55 -50 -75 -70 -65 -60 -55 -50 -45 (d) -45 (j) 80 40 0 -10 100 60 0 80 80 40 60 -10 20 60 60 20 20 40 0 40 40 0 -10 -10 20 -20 20 20 -20 0 10 -75 -70 -65 -60 -55 -50 -75 -70 -65 -60 -55 -50 10 0 -20 -45 (e) 10 (k) 100 10 -45 80 0 -75 -70 -65 -60 -55 -50 -45 -75 -70 -65 -60 -55 -50 (f) -45 (l) 0 80 0 40 -10 60 -10 20 -10 40 0 -10 20 -20 -20 20 20 0 -75 -70 -65 -60 -55 -50 -45 -75 -70 -65 -60 -55 -50 -45 100 80 80 100 60 60 80 80 40 40 60 60 20 20 40 40 0 0 100 60 -20 100 80 0 100 60 -20 100 0 -20 -75 -70 -65 -60 -55 -50 -45 -75 -70 -65 -60 -55 -50 -45
