Math 110A – Calc I
advertisement

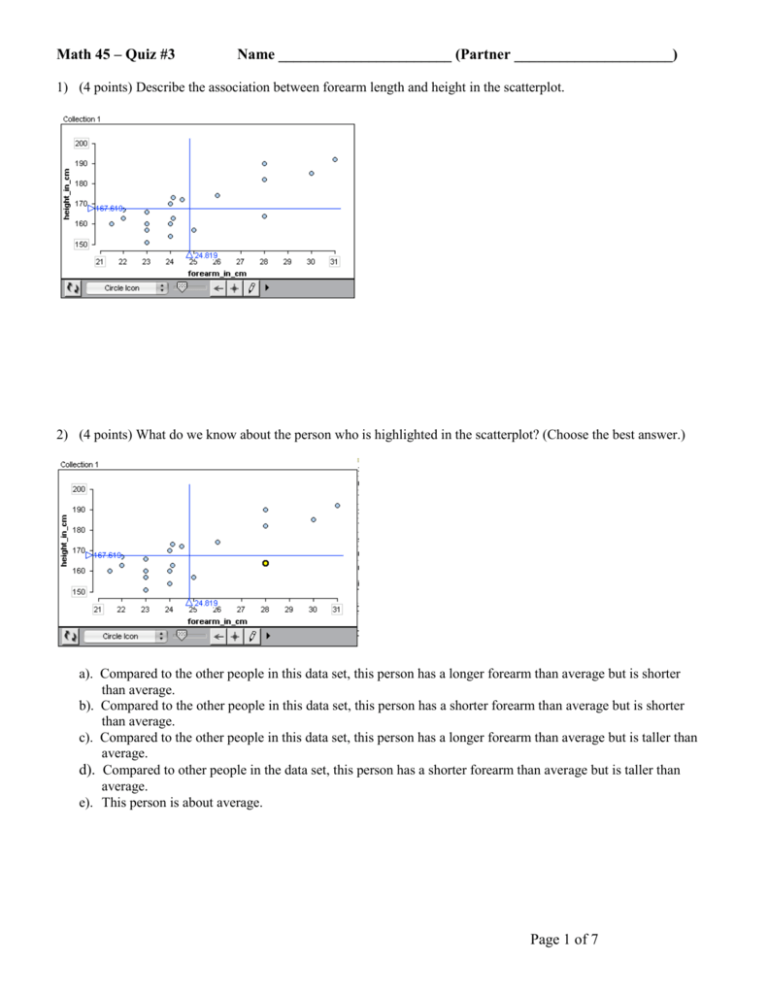
Math 45 – Quiz #3 Name _______________________ (Partner _____________________) 1) (4 points) Describe the association between forearm length and height in the scatterplot. 2) (4 points) What do we know about the person who is highlighted in the scatterplot? (Choose the best answer.) a). Compared to the other people in this data set, this person has a longer forearm than average but is shorter than average. b). Compared to the other people in this data set, this person has a shorter forearm than average but is shorter than average. c). Compared to the other people in this data set, this person has a longer forearm than average but is taller than average. d). Compared to other people in the data set, this person has a shorter forearm than average but is taller than average. e). This person is about average. Page 1 of 7 3) (4 points) Do you think there will be an association between these two variables for community college students? If so, will the association be positive or negative? Explain briefly. x = Average weekly hours spent working at a job; y = Average weekly hours spent doing homework 4) (4 points) The table below gives information for the first few months of payments if you borrowed $20,000 in the Undergraduate Stafford Loan program. Is the association between principal paid (x) and interest paid (y) positive or negative? How can you tell? 5) (4 points) The data in the scatterplot are an individual's weight and the time it takes (in seconds) on a treadmill to raise their pulse rate to 140 beats per minute. The o's correspond to females and the +'s correspond to males. Based on the scatterplot, what can we conclude about the females in the graph? Explain briefly. Page 2 of 7 6) (4 points) All but one of the following statements contains a mistake. Using what you now know about the correlation r, which one does NOT contain a mistake? a). There is a correlation of r = 0.54 between the position a football player plays and his weight. b). The correlation between amount of fertilizer and yield of tomatoes was found to be r = 0.33. c). The correlation between the gas mileage of a car and its weight is r = 1.71. 7) (4 points) A recent article in an educational research journal reports a correlation of +0.8 between math achievement and overall math aptitude. It also reports a correlation of -0.8 between math achievement and a math anxiety test. Which of the following interpretations is the most correct? a). The correlation of +0.8 indicates a stronger relationship than the correlation of -0.8. b). The correlation of +0.8 is just as strong as the correlation of -0.8. c). It is impossible to tell which correlation is stronger. 8) (4 points each) Estimate the correlation coefficient (r) for each scatterplot. r= r= r= 8) A recent research study randomly divided participants into groups who were given different levels of Vitamin E to take daily. One group received a placebo pill. The research study followed participants for 8 years to see how many developed a specific type of cancer. Which of the following responses gives the best explanation as to the purpose of randomization in this study? a). b). c). d). To increase the accuracy of the research results. To ensure that all potential cancer patients had an equal chance of being selected for the study. To reduce the effects of confounding variables by creating treatment groups with similar characteristics. To prevent skewness in the results. Page 3 of 7 9) A teacher conducted an experiment to study the impact of classical music on concentration. Students were divided into two groups. Students who said they had experience with, and enjoyed, word puzzles did a word puzzle while listening to a Mozart piano concerto. Students who did not have experience with word puzzles, or disliked them, did a word puzzle in a quiet environment. Both groups were given the same amount of time to do the puzzle. The number of words correctly identified in the word puzzle was recorded for each group and graphed below. What can we conclude? a). Mozart improves concentration. The mean number of words found by students listening to Mozart was about double the mean number of words found by students in the quiet environment. In addition the typical range of words found in the music group, as defined by the average deviation hatplot, was higher than that of the control group with no overlap in values within one average deviation of the mean. b). There was variability in the words found in each group and overlap in the results. Listening to Mozart may help some students and distract other students. We cannot conclude that Mozart improved concentration. c). The results of the experiment were confounded by the way students were assigned to the treatments. We cannot conclude that Mozart improved concentration because the experience level and attitude toward doing word puzzles may explain the better performance of the group listening to Mozart. 10) A random sample of 25 Real Estate listings for houses in the Northeast section of a large city was selected from the city newspaper. A correlation coefficient of -.80 was found between the age of a house (x) and its list price (y). Which of the following statements is the best interpretation of this correlation? a). b). c). d). Older houses tend to cost more money than newer houses. Newer houses tend to cost more money than older houses. Older houses are worth more because they were built with higher quality materials and labor. New houses cost more because supplies and labor are more expensive today. Page 4 of 7 11) The weights of the male and female students in a class are summarized in the following boxplots. Which of the following is false? a). b). c). d). About 50% of the male students have weights between 150 and 185 pounds. About 25% of the female students have weights more than 130 pounds. The male students have less variability than the female students. None of the above. 12) In a survey, students at two community colleges estimated the number of hours they spend on Facebook each week. Which college (College A or B) has a greater percentage of students spending more than 10 hours per week on Facebook? a). b). c). d). College A College B Both Colleges are equal. It is impossible to tell. Page 5 of 7 Use this for Questions #13 and #14. The 1999 Consumer Reports new Car Buying Guide reported on the number of seconds required for a variety of cars to accelerate from 0 to 30 mph. The cars were also classified into six categories according to type. The boxplots for acceleration times for each type of car are given below. 13) If the outliers were removed from the dataset of Small cars, which of the following statistics would be least affected? a). b). c). d). Range Interquartile range (IQR) Average distance from the mean (ADM) All are equally affected. 14) If we compare a typical car in each category, which type accelerates the fastest? What part of the boxplots did you compare to make your choice? a). b). c). d). e). Sports cars because the range is the longest (length of the boxplot). Sports cars because the median is the lowest. Small cars because the median is the highest. Family cars because they have the highest value at 4.5. Sports car because the interquartile range is the longest. Page 6 of 7 15) A company wants to see if installing a wind turbine to generate electricity is economically feasible. As part the feasibility study at random times during June, the company measured the wind speed, W, in miles per hour. The raw data is listed below: 1, 2, 2, 2, 2, 3, 3, 3, 3, 3, 3, 4, 4, 4, 6 a) Find the 5-Number Summary for the wind speed. Show some work, please. b) Construct a box plot for the wind speed: Page 7 of 7


