the adaptable Word resource
advertisement
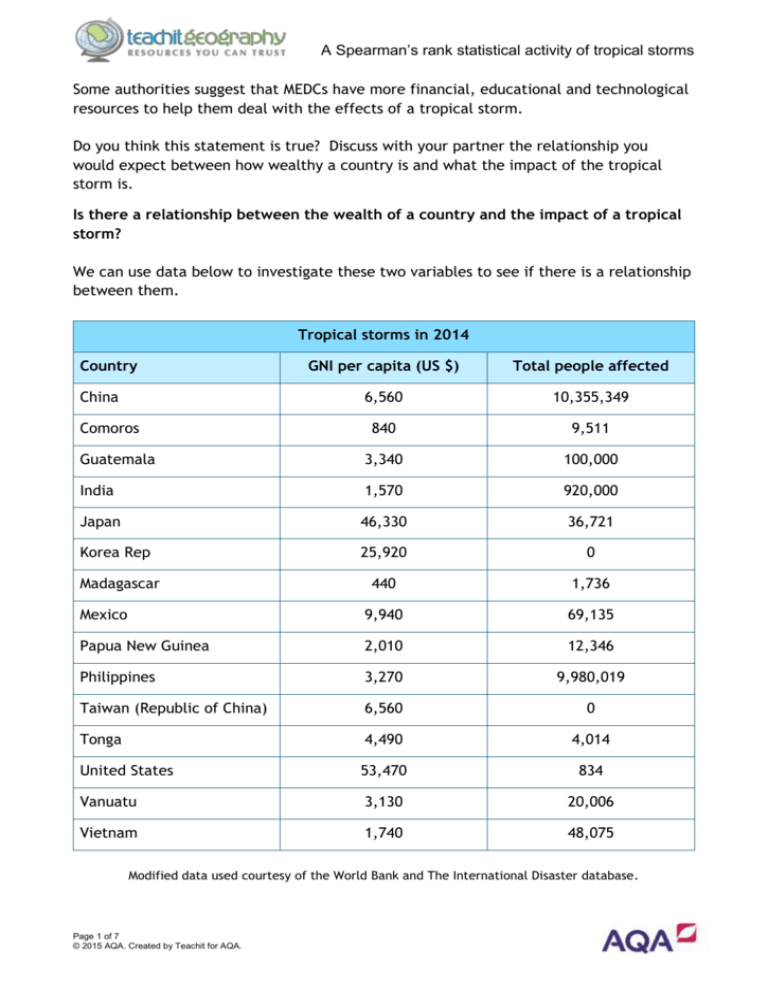
A Spearman’s rank statistical activity of tropical storms Some authorities suggest that MEDCs have more financial, educational and technological resources to help them deal with the effects of a tropical storm. Do you think this statement is true? Discuss with your partner the relationship you would expect between how wealthy a country is and what the impact of the tropical storm is. Is there a relationship between the wealth of a country and the impact of a tropical storm? We can use data below to investigate these two variables to see if there is a relationship between them. Tropical storms in 2014 Country GNI per capita (US $) Total people affected 6,560 10,355,349 840 9,511 Guatemala 3,340 100,000 India 1,570 920,000 Japan 46,330 36,721 Korea Rep 25,920 0 Madagascar 440 1,736 Mexico 9,940 69,135 Papua New Guinea 2,010 12,346 Philippines 3,270 9,980,019 Taiwan (Republic of China) 6,560 0 Tonga 4,490 4,014 United States 53,470 834 Vanuatu 3,130 20,006 Vietnam 1,740 48,075 China Comoros Modified data used courtesy of the World Bank and The International Disaster database. Page 1 of 7 © 2015 AQA. Created by Teachit for AQA. A Spearman’s rank statistical activity of tropical storms What relationship could there be? One method of investigating the relationship between the wealth of a country and the impact of a tropical storm is to draw a scatter graph. This will allow us to see any possible relationship between two variables in a simple way. Use the graph paper template to draw a scatter graph of the Gross National Income and the number of people affected in the country. Scatter graph template Number of people affected (in millions) 10 5 0 10 20 30 40 50 60 Gross National Income per capita (US$ thousands) Title: ...................................................................... ...................................................................... Page 2 of 7 © 2015 AQA. Created by Teachit for AQA. A Spearman’s rank statistical activity of tropical storms Visualising the relationship Describe what the scatter graph shows you. ............................................................................................................ ............................................................................................................ ............................................................................................................ GNI per capita Number of people affected Number of people affected Number of people affected The relationship can also be described in statistical terms. Below are three ways the data might look once plotted on the scattergraph: GNI per capita Positive relationship Negative relationship (As one variable goes up, the other variable goes up) (As one variable goes up, the other variable goes down) GNI per capita No relationship Use the sketches of the three relationship types above to describe what the scattergraph shows us in statistical terms. ............................................................................................................ ............................................................................................................ Explain why the scattergraph shows this relationship. Give reasons for the relationship you can see. ............................................................................................................ ............................................................................................................ ............................................................................................................ Page 3 of 7 © 2015 AQA. Created by Teachit for AQA. A Spearman’s rank statistical activity of tropical storms THE SPEARMAN’S RANK TEST We now need to see whether this relationship is statistically significant. To do this, we can conduct a statistical test called the Spearman’s rank test. This test will provide a numerical value between -1 and +1, which gives an indication of the strength of a possible relationship between the Gross National Income and the number of people affected in the country. A value close to zero suggests the lack of a statistical relationship i.e. a random pattern. The numerical value also confirms the direction of the relationship. A negative value indicates the possibility of a negative relationship between the two variables and the closer the answer is to -1, the stronger the possibility of a negative relationship and vice versa with a positive result suggesting a positive relationship. The Spearman rank formula is: 𝑟𝑠 = 1 − 6 ∑ 𝑑2 𝑛3 −𝑛 𝑟𝑠 is the Spearman’s rank test result (this result will always be between -1 and +1). 𝑑 is the difference between the rank of the gross national income per capita and the rank of the total number of people affected. 𝑛 is the number of pairs of data (In this case is 15). Method 1. Assume there is no relationship between the variables. 2. State the null hypothesis – that there is no relationship between the two variables There is no ........................................................................................ . 3. Complete the ranks in the table. Madagascar has been completed for you. Order each column of data separately. A tied rank takes the average value of the ranks that they would have been. Calculate the differences between the ranks. 4. Square the individual differences. 5. Calculate the sum of the d2 column (∑ 𝑑2 ) 6. Multiply ∑ 𝑑 2 by 6 (Answer A) Answer A 7. Calculate n3 = n x n x n (Answer B) 15 x 15 x 15 in this Answer B example Answer C 8. Subtract n from Answer B to give answer C 9. Divide 6 ∑ 𝑑2 by (n3 – n) to give answer D Calculate 1 – the value of answer D to give you Page 4 of 7 © 2015 AQA. Created by Teachit for AQA. Answer D 𝑟𝑠 = 1 − 6 ∑ 𝑑2 𝑛3 −𝑛 A Spearman’s rank statistical activity of tropical storms Country GNI per capita (in US $) China Rank 6,560 Comoros 840 Total affected Rank 2 -3 9 9,511 3,340 India 1,570 Japan 46,330 36,721 Korea Rep 25,920 0 1.5 Madagascar 440 1,736 4 100,000 3 920,000 1 Mexico 9,940 69,135 Papua New Guinea 2,010 12,346 Philippines 3,270 9,980,019 Taiwan (Republic of China) 6,560 0 1.5 Tonga 4,490 4,014 5 United States 53,470 834 3 Vanuatu 3,130 20,006 Vietnam 1,740 4 48,075 ∑ 𝑑2 n3 - n 6 ∑ 𝑑2 6 ∑ 𝑑2 𝑛3 − 𝑛 n3 Page 5 of 7 © 2015 AQA. Created by Teachit for AQA. d2 10,355,349 Guatemala The Spearman rank formula is: d 𝑟𝑠 = 1 − 𝑟𝑠 = 1 − 6 ∑ 𝑑2 𝑛3 −𝑛 6 ∑ 𝑑2 𝑛3 − 𝑛 = A Spearman’s rank statistical activity of tropical storms Calculation answer What is your 𝑟𝑠 value? The result should be between -1 (a perfectly negative correlation) and +1 (a perfectly positive correlation) The nearer to 0, the weaker the correlation. If your number exceeds the range -1 to +1 then there is a mistake in the calculation. Significance We need to know how statistically significant this answer is. Is it close enough to either +1 or -1 to be called a correlation? With 15 pairs of data the critical value, which it needs to exceed, is 0.44. Place your 𝑟𝑠 result on the line below: -1 0 Significant +1 Not significant -0.44 Significant +0.44 Look at the area where your 𝑟𝑠 result falls. Is your result significant or not significant? Return to your hypothesis and if the result is not significant, you need to accept the null hypothesis you wrote. If it is significant, you need to conclude an alternative hypothesis, that there is a significant relationship between the two variables. Extension tasks This exercise has only considered the two variables of wealth of country (as measured by GNI per capita) and level of impact (as measured by the number of people who were affected by the event). If you were to extend this study, which other variables could you use to investigate a relationship? How else could you measure the level of impact? Page 6 of 7 © 2015 AQA. Created by Teachit for AQA. A Spearman’s rank statistical activity of tropical storms Teaching notes The calculations for the Spearman rank activity are provided below: GNI per capita (in US $) Rank Total affected Rank d d2 6,560 10.5 10,355,349 15 -4.5 20.25 840 2 9,511 6 -4 16 Guatemala 3,340 8 100,000 12 -4 16 India 1,570 3 920,000 13 -10 100 Japan 46,330 14 36,721 9 5 25 Korea Rep 25,920 13 0 1.5 11.5 132.25 Madagascar 440 1 1,736 4 -3 9 Mexico 9,940 12 69,135 11 1 1 Papua New Guinea 2,010 5 12,346 7 -2 4 Philippines 3,270 7 9,980,019 14 -7 49 Taiwan (Republic of China) 6,560 10.5 0 1.5 9 81 Tonga 4,490 9 4,014 5 4 16 United States 53,470 15 834 3 12 144 Vanuatu 3,130 6 20,006 8 -2 4 Vietnam 1,740 4 48,075 10 -6 36 Country China Comoros ∑ 𝑑2 635.5 n3 - n 3360 6 ∑ 𝑑2 3813 1.13 n3 3375 6 ∑ 𝑑2 𝑛3 − 𝑛 6 ∑ 𝑑2 𝑟𝑠 = 1 − 3 𝑛 −𝑛 Page 7 of 7 © 2015 AQA. Created by Teachit for AQA. -0.13

