Supplemental Material

Supplemental Material
It should be noted that the notion of sensitivity should not be confused with that of resolution.
Sensitivity defines the ability of SESF approach to detect a change in axial spatial period of an object from H z A
to H z B
due to external perturbation; while the resolution defines the ability to resolve an object with two spatial periods H z A
and H z B
that co-exist within the same object.
SESF approach reconstructs the axial profile of the 3D Fourier spectrum. We note that in SESF approach, for a given configuration (i.e., illumination and collection angles), the sensitivity only depends on spectral resolution, but the resolution depends on both spectral resolution and the spatial extent of the object’s scattering volume due to the nature of Fourier relationship between the object-space and its corresponding Fourier-space (i.e., spatial frequency), which relates to all
Fourier-based reconstruction techniques, not just to SESF approach.
We synchronized the cells at G
1
/S and G
2
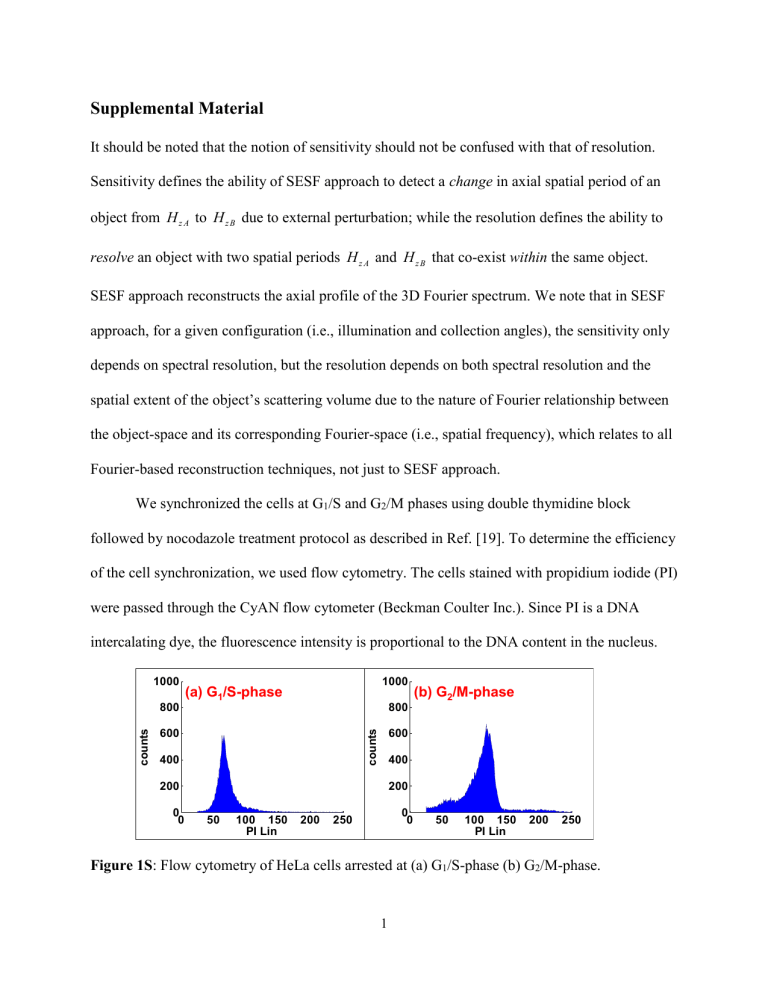
/M phases using double thymidine block followed by nocodazole treatment protocol as described in Ref. [19]. To determine the efficiency of the cell synchronization, we used flow cytometry. The cells stained with propidium iodide (PI) were passed through the CyAN flow cytometer (Beckman Coulter Inc.). Since PI is a DNA intercalating dye, the fluorescence intensity is proportional to the DNA content in the nucleus.
1000
800
(a) G
1
/S-phase
600
400
200
0
0 50 100 150 200 250
PI Lin
1000
800
(b) G
2
/M-phase
600
400
200
0
0 50 100 150 200 250
PI Lin
Figure 1S : Flow cytometry of HeLa cells arrested at (a) G
1
/S-phase (b) G
2
/M-phase.
1
As shown in Fig. 1S, about 81% of the cells are arrested at G
1
/S-phase and 70% cells are arrested at G
2
/M-phase. Cells arrested at the G
1
/S-phase have approximately 2N DNA content while cells arrested at the G
2
/M-phase have a 4N DNA content.
To prepare cells for TEM imaging, cells grown on tissue culture dish were fixed in 2.5% glutaraldehyde in 100 mM phosphate buffered saline (PBS) (8 gm/l NaCl, 0.2 gm/l KCl, 1.15 gm/l Na
2
HPO
4
.
7H
2
O, 0.2 gm/l KH
2
PO
4, pH 7.4) overnight at 4 o
C. Cell monolayers were then washed in PBS 3 times and post-fixed in aqueous 1% osmium tetroxide, 1% Fe
6
CN
3
for 1 hr.
Cells were further washed 3 times in PBS then dehydrated through a 30-100% ethanol series then embedded in Polybed 812 resin (Polysciences, Warrington, PA). Cultures were embedded in by inverting Polybed 812-filled BEEM capsules on top of the cells. Blocks were cured overnight at 37 o
C, then cured for two days at 65 o
C. Monolayers were pulled off the coverslips and re-embedded for sectioning. Ultrathin cross sections (60 nm) of the cells were obtained on a
Riechart Ultracut E microtome, post-stained in 4% uranyl acetate for 10 min and 1% lead citrate for 7 min. Sections were viewed on a JEOL JEM 1011 transmission electron microscope (JEOL,
Peobody MA) at 80 KV. Images were taken using a side-mount AMT 2k digital camera
(Advanced Microscopy Techniques, Danvers, MA).
To extract the nanoscale spatial period profile of the intra-nuclear structures of those cells arrested at G
1
/S and G
2
/M phase, we performed the Fourier analysis of the TEM images from the cell nuclei. Specifically, two-dimensional Fourier transform of the TEM images of the cell nucleus was performed for the range of spatial frequencies (in both dimensions) corresponding to the axial range of spatial frequency (2800 to 5300 1/mm) captured by the optical system, as shown in Fig. 2S. The two-dimensional image was treated as axial slices along two separable directions. The marginal sum of the Fourier transform along any one of the dimensions was
2
taken, and the resulting spatial frequency profile was transformed to the corresponding spatial period profile, as shown in Fig. 4(c) (of the manuscript). It should be noted that in comparison to the in-situ structural quantification of SESF approach, TEM imaging requires the destructive sample preparation with multiple random sections. Therefore, the spatial frequency extracted from TEM image analysis may have a certain level of discrepancy to that from SESF approach.
(a)
G
1
/S phase
-5
FT nucleus
-2.5
0
2.5
5
-5 -2.5
0 2.5
Spatial frequency (1/
m)
5
3.5
3 (e)
4
4.5
5
3 3.5
4 4.5
Spatial frequency (1/
m)
5
(b)
G
2
/M phase
-5
FT nucleus
-2.5
0
2.5
5
-5 -2.5
0 2.5
Spatial frequency (1/
m)
5
3.5
3 (f)
4
4.5
5
3 3.5
4 4.5
Spatial frequency (1/
m)
5
Figure 2S : TEM image analysis of cell nuclei at (a) G
1
/S and (b) G
2
/M phase; (c), (d) Fouriertransformed images of each cell nucleus at G
1
/S and G
2
/M phase, respectively; (e), (f) The magnified portion of Fourier images for the same spatial frequency range captured by the optical system.
3


