lno10248-sup-0001-suppinfo01
advertisement
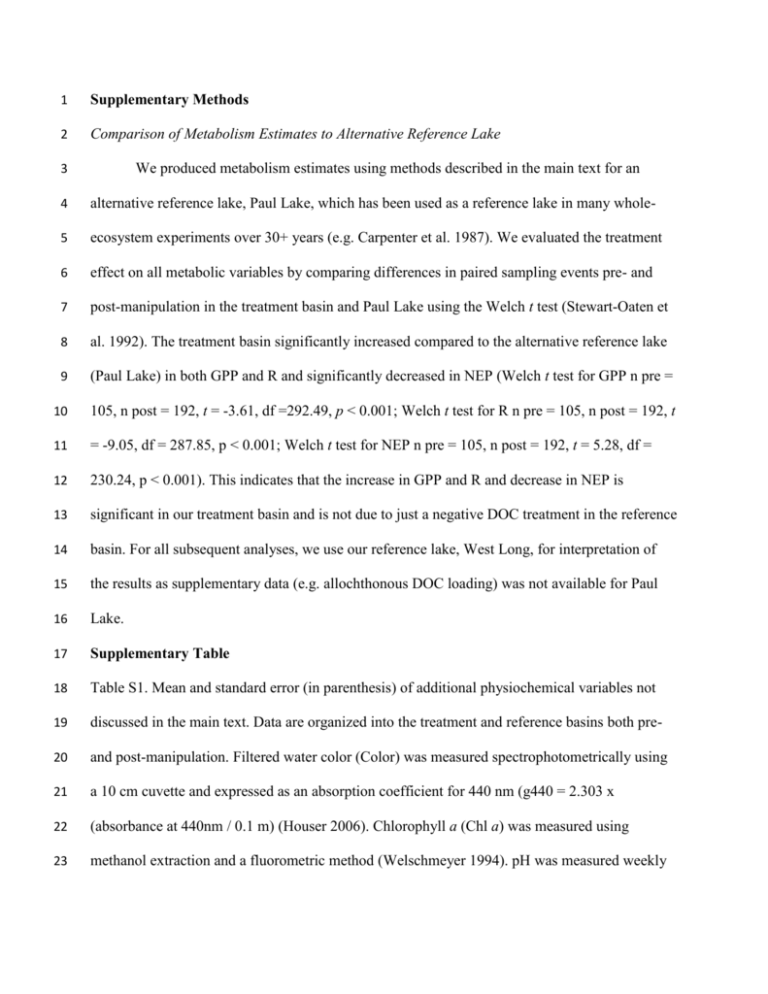
1 Supplementary Methods 2 Comparison of Metabolism Estimates to Alternative Reference Lake 3 We produced metabolism estimates using methods described in the main text for an 4 alternative reference lake, Paul Lake, which has been used as a reference lake in many whole- 5 ecosystem experiments over 30+ years (e.g. Carpenter et al. 1987). We evaluated the treatment 6 effect on all metabolic variables by comparing differences in paired sampling events pre- and 7 post-manipulation in the treatment basin and Paul Lake using the Welch t test (Stewart-Oaten et 8 al. 1992). The treatment basin significantly increased compared to the alternative reference lake 9 (Paul Lake) in both GPP and R and significantly decreased in NEP (Welch t test for GPP n pre = 10 105, n post = 192, t = -3.61, df =292.49, p < 0.001; Welch t test for R n pre = 105, n post = 192, t 11 = -9.05, df = 287.85, p < 0.001; Welch t test for NEP n pre = 105, n post = 192, t = 5.28, df = 12 230.24, p < 0.001). This indicates that the increase in GPP and R and decrease in NEP is 13 significant in our treatment basin and is not due to just a negative DOC treatment in the reference 14 basin. For all subsequent analyses, we use our reference lake, West Long, for interpretation of 15 the results as supplementary data (e.g. allochthonous DOC loading) was not available for Paul 16 Lake. 17 Supplementary Table 18 Table S1. Mean and standard error (in parenthesis) of additional physiochemical variables not 19 discussed in the main text. Data are organized into the treatment and reference basins both pre- 20 and post-manipulation. Filtered water color (Color) was measured spectrophotometrically using 21 a 10 cm cuvette and expressed as an absorption coefficient for 440 nm (g440 = 2.303 x 22 (absorbance at 440nm / 0.1 m) (Houser 2006). Chlorophyll a (Chl a) was measured using 23 methanol extraction and a fluorometric method (Welschmeyer 1994). pH was measured weekly 24 at 0.5 m intervals using a YSI multiprobe profiler (YSI Professional Plus; YSI Incorporated), and 25 we average all measurements in the surface mixed layer for each sampling date. Particulate 26 organic carbon (POC) was analyzed by filtering approximately 200 mL of water from the 27 surfaced mixed layer through 0.45 µm GF/F filters. POC samples were run on a Finnigan Delta 28 Plus isotope ratio mass-spectrometer (Thermo Scientific, Waltham, Massachusetts, USA). 29 Soluble reactive phosphorus (SRP) was measured on filtered water using a colorimetric assay 30 (Menzel and Corwin 1965). Total nitrogen (TN) was analyzed using a spectrophotometric 31 method following persulfate digestion of unfiltered water (Olsen 2008). Iron (Fe) concentrations 32 were measured by inductively coupled argon plasma spectrophotometry (ICP) on a Thermo 33 Elemental Iris Intrepid ICP-OES using Standard Method 3120 B (APHA 1995; EPA 1994) with 34 a method detection limit of 0.05 mg L-1. Fe measurements were done in the Grand Rapids 35 Forestry Sciences Lab of the USDA Forest Service. Color, TN, Fe, and Chl a significantly 36 increased in the treatment basin while pH significantly decreased (Welch t test for Color n pre = 37 27, n post = 29, t = -15.59, df =51.94, p < 0.001; for TN n pre = 25, n post = 16, t = -2.19, df 38 =16.02, p = 0.044; for Fe n pre = 7, n post = 7, t = -4.38, df = 7.86, p = 0.002; for Chl a n pre = 39 25, n post = 30, t = -2.23, df = 43.83, p = 0.031; for pH n pre = 22, n post = 11, t = 2.70, df = 40 13.49, p = 0.018). Particulate organic carbon and SRP did not significantly change due to the 41 experimental manipulation (Welch t test for POC n pre = 27, n post = 26, t = -1.37, df =43.01, p 42 = 0.18; for SRP n pre = 24, n post = 24, t = -0.71, df = 45.81, p = 0.48). Observations of the pre- 43 (n pre) and post-manipulation (n post) periods are from paired sampling time points. 44 Basin (Pre / Post Color Chl a manipulation) (g440) (µg L-1) Treatment (Pre) 3.99 (0.15) 6.48 (0.55) Reference (Pre) 3.52 (0.19) Treatment (Post) Reference (Post) pH POC SRP TN Fe (mg L-1) (µg L-1) (µg L-1) (mg L-1) 6.07 (0.11) 0.72 (0.08) 5.17 (0.29) 446.58 (12.36) 0.04 (0.01) 6.22 (0.48) 6.50 (0.13) 0.65 (0.05) 5.23 (0.82) 433.43 (9.74) 0.03 (0.01) 7.02 (0.23) 7.93 (1.14) 5.94 (0.18) 0.86 (0.08) 6.63 (0.79) 498.67 (60.59) 0.12 (0.04) 3.16 (0.11) 4.95 (0.60) 6.91 (0.10) 0.67 (0.05) 5.85 (0.84) 348.10 (21.20) 0.06 (0.05) 45 46 References 47 APHA. 1995. Standards methods for the examination of water and wastewater, 19th ed., 48 American Public Health Association / American Waters Works Association / Water 49 Environment Federation, Washington, DC. 50 Carpenter, S. R., J. F. Kitchell, J. R. Hodgson, P. A. Cochran, J. J. Elser, M. M. Elser, D. M. 51 Lodge, D. Kretchmer, X. He, & C. N. von Ende. 1987. Regulation of lake primary productivity 52 by food web structure. Ecology 68: 1863-1876, doi: 10.2307/1939878 53 EPA. 1994. T.D. Martin, C.A. Brockhoff, J.T. Creed, and EMMC Methods Work Group, 54 Method. 2007. Determination of metals and trace elements in water and wastes by inductively 55 coupled plasma-atomic emission spectrometry, Revision 4.4. U. S. Environmental Protection 56 Agency. http://water.epa.gov/scitech/methods/cwa/bioindicators/upload/2007_07_10_methods_ 57 method_200_7.pdf 58 Houser, J. N. 2006. Water color affects the stratification, surface temperature, heat content, and 59 mean epilimnetic irradiance of small lakes. Can. J. Fish. Aquat. Sci. 63: 2447-2455, doi: 60 10.1007/s10021-015-9848-y 61 Menzel, D. W., and N. Corwin. 1965. The measurement of total phosphorous in seawater based 62 on the liberation of organically bound fractions by persulfate oxidation. Limnol. Oceanogr. 10: 63 280–282, doi: 10.4319/lo.1965.10.2.0280 64 Olsen, K. K. 2008. Multiple wavelength ultraviolet determinations of nitrate concentration, 65 method comparisons from the preakness brook monitoring project, October 2005 to October 66 2006. Water, Air, and Soil Pollution 187:195–202, doi: 10.1007/s11270-007-9508-8 67 Welschmeyer, N. A. 1994. Fluorometric analysis of chlorophyll-a in the presence of chlorophyll- 68 b and pheopigments. Limnol. Oceanagr. 39:1985–1992, doi: 10.4319/lo.1994.39.8.1985 69
