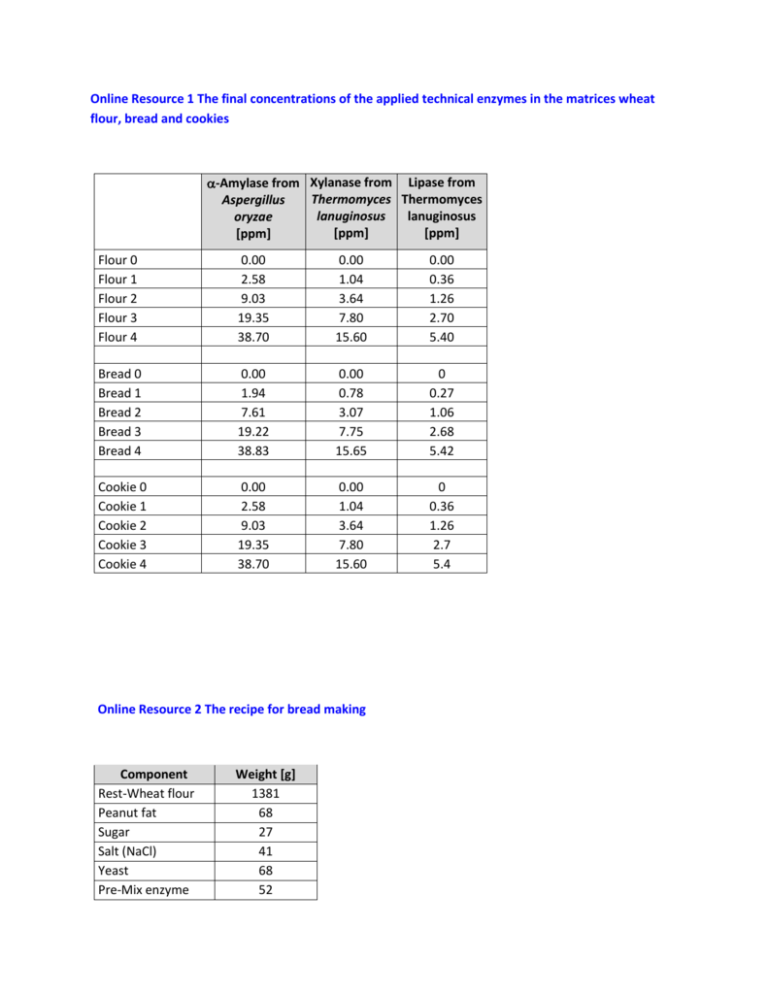
Online Resource 1 The final concentrations of the applied technical
advertisement

Online Resource 1 The final concentrations of the applied technical enzymes in the matrices wheat flour, bread and cookies -Amylase from Xylanase from Lipase from Thermomyces Thermomyces Aspergillus lanuginosus lanuginosus oryzae [ppm] [ppm] [ppm] Flour 0 Flour 1 Flour 2 Flour 3 Flour 4 0.00 2.58 9.03 19.35 38.70 0.00 1.04 3.64 7.80 15.60 0.00 0.36 1.26 2.70 5.40 Bread 0 Bread 1 Bread 2 Bread 3 Bread 4 0.00 1.94 7.61 19.22 38.83 0.00 0.78 3.07 7.75 15.65 0 0.27 1.06 2.68 5.42 Cookie 0 Cookie 1 Cookie 2 Cookie 3 Cookie 4 0.00 2.58 9.03 19.35 38.70 0.00 1.04 3.64 7.80 15.60 0 0.36 1.26 2.7 5.4 Online Resource 2 The recipe for bread making Component Rest-Wheat flour Peanut fat Sugar Salt (NaCl) Yeast Pre-Mix enzyme Weight [g] 1381 68 27 41 68 52 Water Total 889 2500 Online Resource 3 The recipe for cookies Component Rest-Wheat flour Sunflower margarine Sugar Baking powder Pre-Mix enzyme Water Total Weight [g] 255 100 100 9 36 100 600 Online Resource 4 Preparation of calibration standards for HPLC-MS/MS The peptides were obtained from peptides&elephants GmbH (Potsdam, Germany). Solvents Extraction buffer: Dissolve 7.9g Ammonium bicarbonate, 240 g Urea, 0.78 g 1,4-Dithiothreitol in 1000 ml distilled water. All chemicals were from Carl Roth GmbH + Co. KG (Karlsruhe, Germany). Buffer A: 100ml distilled water + 100ml Acetonitrile (Merck KGaA, Darmstadt, Germany) + 0.2 ml formic acid (Carl Roth GmbH + Co. KG, Karlsruhe, Germany). Buffer B: 200 ml distilled water + 0.2 ml formic acid (Carl Roth GmbH + Co. KG, Karlsruhe, Germany). Protein standard for digestion control A stock solution of α-Amylase from Bacillus licheniformis was prepared by dissolving 5.46 mg in 1 ml of the extraction buffer. ISTD for α-Amylase from Bacillus licheniformis A corresponding specific peptide (peptide sequence: EGDSSVANSGLAALITDGPGGAK, MW = 2086.02) for α-Amylase from Bacillus licheniformis was prepared by dissolving 2.4 mg in 1 ml buffer A to get a stock solution. 416.7 µl were than diluted to 10 ml with buffer B to give DL1 ISTD solution. This (2 ml DL1 ISTD) was further diluted with buffer B (8 ml) to produce DL2 ISTD. Peptide standard for isotope marked peptides Stock solutions Peptide Xylanase 493 heavy Xylanase 599 heavy Amylase 329 heavy Amylase 411 heavy Lipase 465 heavy Lipase 575 heavy Lipase 583 heavy Peptide sequence GWNPGLNAR TSGTVQTGCH FDAWAR ALSSALHER NWPIYK SGTLVPVTR GHDGFTSSWR ITHTNDIVPR MW [g/mol] 995.48 1749.18 Weight [mg] 2.8 2.3 Volume buffer A [µl] 500 500 Concentration Stock solution SL [mg/ml] 5600 4600 994.40 829.90 941.07 1160.52 1177.40 3.9 2.7 2.0 2.0 3.1 500 500 500 500 500 7800 5400 4000 4000 6200 Dilutions Peptide Volume SL [µl] Xylanase 493 heavy 178.6 Xylanase 599 heavy 217.4 Amylase 329 heavy 128.2 Amylase 411 heavy 185.2 Lipase 465 heavy 250.0 Lipase 575 heavy 250.0 Lipase 583 heavy 161.3 Peptide standard for unmarked peptides DL 1 Isopepmix [100 ppm] Fill up with buffer B to 10 ml DL1 – Isopepmix enzymes Fill up with buffer B to 10 ml DL1 – Isopepmix lipase DL 2 Isopepmix [5 ppm] Fill up 500 µl DL 1 with buffer B to 10 ml DL2 – Isopepmix enzymes Fill up 500 µl DL 1 with buffer B to 10 ml DL2 – Isopepmix lipase Stock solutions Peptide Xylanase 493 Amylase 411 Lipase 465 Lipase 575 Lipase 583 Dilutions Peptide sequence GWNPGLNAR NWPIYK SGTLVPVTR GHDGFTSSWR ITHTNDIVPR MW [g/mol] 985.41 821.37 930.61 1150.33 1167.51 Weight [mg] 2.5 2.2 2.0 2.2 2.5 Volume buffer A [µl] 500 500 500 500 500 Concentration Stock solution SL [mg/ml] 5000 4400 4000 4400 5000 Peptide Xylanase 493 Amylase 411 Volume SL [µl] DL 1 Isopepmix [100 ppm] 200.0 Fill up with buffer B to 10 ml 227.3 DL1 – Pepmix enzymes Lipase 465 Lipase 575 Lipase 583 250.0 Fill up with buffer B to 10 ml 227.3 DL1 – Pepmix lipase 200.0 DL 2 Isopepmix [0.5 ppm] Fill up 50 µl DL 1 with buffer B to 10 ml DL2 – Pepmix enzymes Fill up 50 µl DL 1 with buffer B to 10 ml DL2 – Pepmix lipase Finally, a further dilution (DL3) was prepared by taking 2 ml DL2 – Pepmix enzymes/lipase and filling up with buffer B to 10 ml [0.1 ppm] All the prepared solutions stored in brown bottles at -18°C. Calibration Calibration point (CP) 0 1 2 3 4 5 6 7 Volume DL3 Pepmix Enzymes/lipase [µl] 2 5 10 20 100 200 400 600 Volume DL2 Isopepmix Volume Volume Final enzymes/lipase [µl] DL2 ISTD buffer concentration [µl] B [µl] for CP [ppm] 40 100 858 0.0002 40 100 855 0.0005 40 100 850 0.0010 40 100 840 0.0020 40 100 760 0.0100 40 100 660 0.0200 40 100 460 0.0400 40 100 260 0.0600 Final concentration for the isotope marked peptides is 0.2 ppm. Final concentration of the specific peptide (EGDSSVANSGLAALITDGPGGAK) for α-Amylase from Bacillus licheniformis is 2.0 ppm Online Resource 5A SDS-PAGE of Lipase FE-01 – the marked protein band was excised, treated and digested by trypsin and analysed by MALDI-TOF-MS as described in methods section. Online Resource 5B Peptide calibration standard II for MALDI-TOF-MS Peptide Bradykinin 1-7 Angiotensin II Angiotensin I Substance P Bombesin Renin Substrate ACTH clip 1-17 ACTH clip 18-39 Somatostatin 28 [M+H]+ Mono isotopic 757.3992 1046.5418 1296.6848 1347.7354 1619.8223 1758.9326 2093.0862 2465.1983 3147.4710 [M+H]+ Average 757.86 1047.19 1297.49 1348.64 1620.86 1760.03 2094.43 2466.68 3149.57 Online Resource 6 Peptides identified (black) in sequence of lipase of Thermomyces lanuginosus by MALDI-TOF-MS Sample 1 Sample 2 Sample 3 Online Resource 7 Results of BLAST and Align analysis for the sequence of lipase of Thermomyces lanuginosus (LIP_THELA) as determined by MALDI-TOF-MS analysis The Basic Local Alignment Search Tool (BLAST) was applied to find regions of local similarity between sequences, which can be used to infer functional and evolutionary relationships between sequences as well as help identify members of gene families. The tool is available online at http://www.uniprot.org/blast/ and the data was re-checked in March 2015 (original report is available). The selection data is summarized and limited to the first few hits. Since the producer of the tested Lipase FE-0 gave the originating organism as from Aspergillus oryzae, an alignment was conducted of the sequence of Lipase from Thermomyces lanuginosus (LIP_THELA) with the corresponding hits from Aspergillus oryzae (G9M5R3_ASPNG and I7ZZJ6_ASPO3) with higher identity similarity (ca. 51 %). The sequence alignment was reproduced using the data in FASTA form available on analysis with the 'Align' tool available at http://www.uniprot.org/align/. The reproduction was achieved using the software Jalview (The Barton Group, University of Dundee, Scotland, UK), Vers 2.8. The peptides used for quantification/qualification with HPLC MS/MS analysis are bordered in red. Code for identity: Online Resource 8 Sequence alignment of amylases from three relevant sources ‐ Aspergillus shirousami (AMY_ASPSH), Triticum aestivum (AMY3_WHEAT) and Bacillus licheniformis (AMY_BACLI) Alignment was conducted online at http://www.uniprot.org/ and the FASTA files were evaluated using the software Jalview Vers.: 2.8 (The Barton group, University of Dundee, Scotland, UK). The peptides marked by the red/green frame were those applied for identification purposes. Code for identity: Online Resource 9 Sequence alignment of xylanases from the two relevant sources ‐ Thermomyces lanuginosus (XYNA_THELA) and Triticum aestivum (AMY3_WHEAT) Alignment was conducted online at http://www.uniprot.org/ and the FASTA files were evaluated using the software Jalview Vers.: 2.8 (The Barton group, University of Dundee, Scotland, UK). The peptides marked by the red frame were those applied for identification purposes. Code for identity: Online Resource 10 Identified peptides of -amylase in test material bread sample 3 (19 ppm -amylase from Aspergillus sp) and that of the internal standard peptide (ISTD 496) of the amylase from Bacillus licheniformis (AMY_BACLI). Online Resource 11 HPLC-MS/MS analysis for peptides of -amylase in test material bread blank – the results show the absence of the corresponding identified peptides of -amylase from Aspergillus sp). The internal standard peptide (ISTD 496) of the amylase from Bacillus licheniformis (AMY_BACLI) is also shown in the last chromatogram. Online Resource 12 Calculation of the recovery based on the internal standard peptide (ISTD 496) of the amylase from Bacillus licheniformis (AMY_BACLI) – example shows illustrates the recovery determination for lipase. The concentration of the lipase 465 found in the digest obtained from wheat flour and baked goods can be determined from the above calibration. The value thus obtained is multiplied by an individual protein-peptide factor, which represents the mass ratio of the enzyme lipase to the lipase 465 (34.18). Since the amount administered in the wheat flour or baked goods is known (supporting information figure S1), the recovery can be calculated in [%]. The protein-peptide factors for -amylase (corresponding peptide -amylase 411) was 66.72 and for xylanase (corresponding peptide xylanase 493) 24.76 respectively. Online Resource 13 Calculation of the recovery based on the isotope marked internal peptide standards for the individual enzymes – example shows illustrates the recovery determination for -amylase in wheat flour, dough, bread and cookies (overnight digestion). Calibration curve: Area ratio = concentration of the amylase 411 / concentration of the isotope labelled amylase 411 Recovery was calculated similar to the method applied in supporting information figure S12. Online Resource 14 Calculation of the recovery based on the isotope marked internal peptide standards for the individual enzymes – example shows illustrates the recovery determination for xylanase in wheat flour, dough, bread and cookies (overnight digestion). Calibration curve: Area ratio = concentration of the xylanase 493 / concentration of the isotope labelled xylanase 493 Recovery was calculated similar to the method applied in supporting information figure S12. Online Resource 15 Calculation of the recovery based on the isotope marked internal peptide standards for the individual enzymes – example shows illustrates the recovery determination for lipase in wheat bread and cookies (overnight digestion). Calibration curve: Area ratio = concentration of the lipase 465 / concentration of the isotope labelled lipase 465 Recovery was calculated similar to the method applied in supporting information figure S12. White columns < LOD = level of detection; grey columns < LOQ = Level of quantification. Online Resource 16 Changes in bread quality by using moderate amount of technical enzymes. The figures shows bread 0 – bread 4 (left to right) with different amounts of the enzymes as given in the supporting information figure S1.


