Experimental Protocol
advertisement
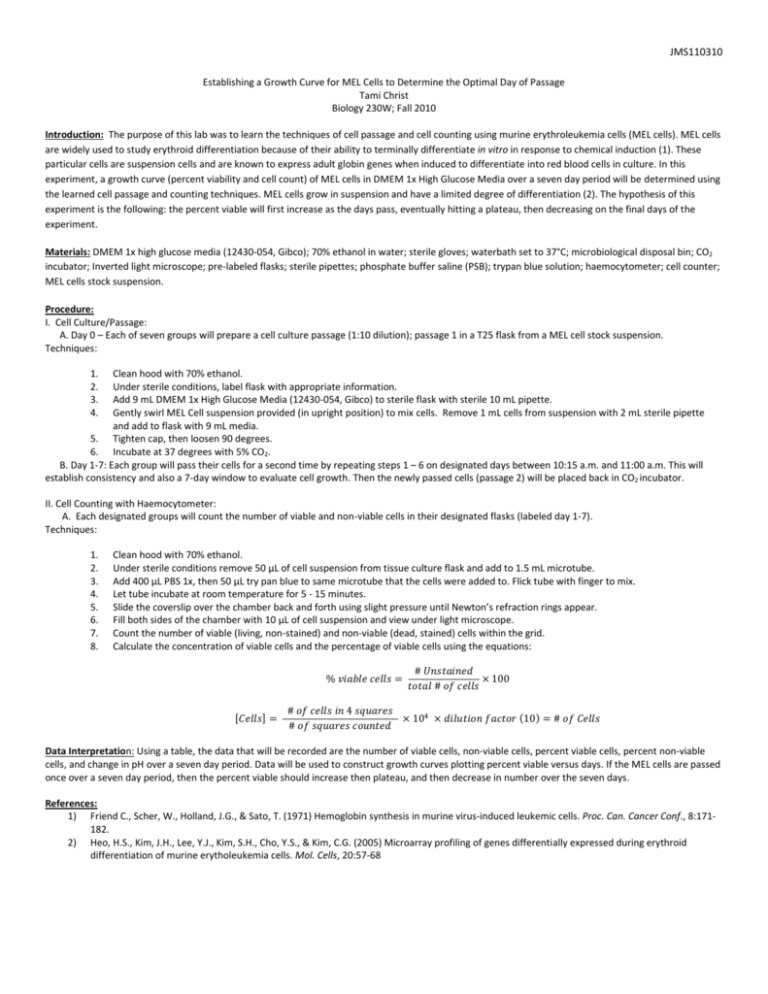
JMS110310 Establishing a Growth Curve for MEL Cells to Determine the Optimal Day of Passage Tami Christ Biology 230W; Fall 2010 Introduction: The purpose of this lab was to learn the techniques of cell passage and cell counting using murine erythroleukemia cells (MEL cells). MEL cells are widely used to study erythroid differentiation because of their ability to terminally differentiate in vitro in response to chemical induction (1). These particular cells are suspension cells and are known to express adult globin genes when induced to differentiate into red blood cells in culture. In this experiment, a growth curve (percent viability and cell count) of MEL cells in DMEM 1x High Glucose Media over a seven day period will be determined using the learned cell passage and counting techniques. MEL cells grow in suspension and have a limited degree of differentiation (2). The hypothesis of this experiment is the following: the percent viable will first increase as the days pass, eventually hitting a plateau, then decreasing on the final days of the experiment. Materials: DMEM 1x high glucose media (12430-054, Gibco); 70% ethanol in water; sterile gloves; waterbath set to 37°C; microbiological disposal bin; CO2 incubator; Inverted light microscope; pre-labeled flasks; sterile pipettes; phosphate buffer saline (PSB); trypan blue solution; haemocytometer; cell counter; MEL cells stock suspension. Procedure: I. Cell Culture/Passage: A. Day 0 – Each of seven groups will prepare a cell culture passage (1:10 dilution); passage 1 in a T25 flask from a MEL cell stock suspension. Techniques: 1. 2. 3. 4. Clean hood with 70% ethanol. Under sterile conditions, label flask with appropriate information. Add 9 mL DMEM 1x High Glucose Media (12430-054, Gibco) to sterile flask with sterile 10 mL pipette. Gently swirl MEL Cell suspension provided (in upright position) to mix cells. Remove 1 mL cells from suspension with 2 mL sterile pipette and add to flask with 9 mL media. 5. Tighten cap, then loosen 90 degrees. 6. Incubate at 37 degrees with 5% CO2. B. Day 1-7: Each group will pass their cells for a second time by repeating steps 1 – 6 on designated days between 10:15 a.m. and 11:00 a.m. This will establish consistency and also a 7-day window to evaluate cell growth. Then the newly passed cells (passage 2) will be placed back in CO2 incubator. II. Cell Counting with Haemocytometer: A. Each designated groups will count the number of viable and non-viable cells in their designated flasks (labeled day 1-7). Techniques: 1. 2. 3. 4. 5. 6. 7. 8. Clean hood with 70% ethanol. Under sterile conditions remove 50 µL of cell suspension from tissue culture flask and add to 1.5 mL microtube. Add 400 µL PBS 1x, then 50 µL try pan blue to same microtube that the cells were added to. Flick tube with finger to mix. Let tube incubate at room temperature for 5 - 15 minutes. Slide the coverslip over the chamber back and forth using slight pressure until Newton’s refraction rings appear. Fill both sides of the chamber with 10 µL of cell suspension and view under light microscope. Count the number of viable (living, non-stained) and non-viable (dead, stained) cells within the grid. Calculate the concentration of viable cells and the percentage of viable cells using the equations: % 𝑣𝑖𝑎𝑏𝑙𝑒 𝑐𝑒𝑙𝑙𝑠 = [𝐶𝑒𝑙𝑙𝑠] = # 𝑈𝑛𝑠𝑡𝑎𝑖𝑛𝑒𝑑 × 100 𝑡𝑜𝑡𝑎𝑙 # 𝑜𝑓 𝑐𝑒𝑙𝑙𝑠 # 𝑜𝑓 𝑐𝑒𝑙𝑙𝑠 𝑖𝑛 4 𝑠𝑞𝑢𝑎𝑟𝑒𝑠 × 104 × 𝑑𝑖𝑙𝑢𝑡𝑖𝑜𝑛 𝑓𝑎𝑐𝑡𝑜𝑟 (10) = # 𝑜𝑓 𝐶𝑒𝑙𝑙𝑠 # 𝑜𝑓 𝑠𝑞𝑢𝑎𝑟𝑒𝑠 𝑐𝑜𝑢𝑛𝑡𝑒𝑑 Data Interpretation: Using a table, the data that will be recorded are the number of viable cells, non-viable cells, percent viable cells, percent non-viable cells, and change in pH over a seven day period. Data will be used to construct growth curves plotting percent viable versus days. If the MEL cells are passed once over a seven day period, then the percent viable should increase then plateau, and then decrease in number over the seven days. References: 1) Friend C., Scher, W., Holland, J.G., & Sato, T. (1971) Hemoglobin synthesis in murine virus-induced leukemic cells. Proc. Can. Cancer Conf., 8:171182. 2) Heo, H.S., Kim, J.H., Lee, Y.J., Kim, S.H., Cho, Y.S., & Kim, C.G. (2005) Microarray profiling of genes differentially expressed during erythroid differentiation of murine erytholeukemia cells. Mol. Cells, 20:57-68
