R5 The intensity of care
Headline
Performance
Data:
Data Source:
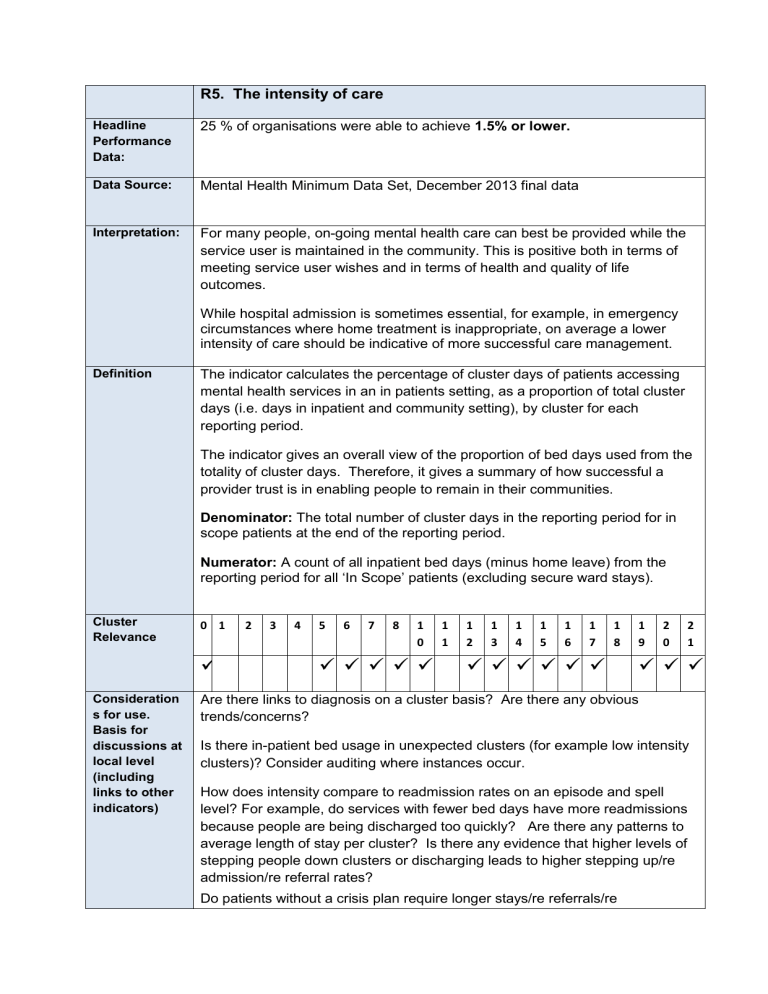
R5. The intensity of care
25 % of organisations were able to achieve 1.5% or lower.
Mental Health Minimum Data Set, December 2013 final data
Interpretation: For many people, on-going mental health care can best be provided while the service user is maintained in the community. This is positive both in terms of meeting service user wishes and in terms of health and quality of life outcomes.
Definition
While hospital admission is sometimes essential, for example, in emergency circumstances where home treatment is inappropriate, on average a lower intensity of care should be indicative of more successful care management.
The indicator calculates the percentage of cluster days of patients accessing mental health services in an in patients setting, as a proportion of total cluster days (i.e. days in inpatient and community setting), by cluster for each reporting period.
The indicator gives an overall view of the proportion of bed days used from the totality of cluster days. Therefore, it gives a summary of how successful a provider trust is in enabling people to remain in their communities.
Denominator: The total number of cluster days in the reporting period for in scope patients at the end of the reporting period.
Numerator: A count of all inpatient bed days (minus home leave) from the reporting period for all ‘In Scope’ patients (excluding secure ward stays).
Cluster
Relevance
0 1 2 3 4 5 6 7 8 1
0
1
1
1
2
1
3
1
4
1
5
1
6
1
7
1
8
1
9
2
0
2
1
Consideration s for use.
Basis for discussions at local level
(including links to other indicators)
Are there links to diagnosis on a cluster basis? Are there any obvious trends/concerns?
Is there in-patient bed usage in unexpected clusters (for example low intensity clusters)? Consider auditing where instances occur.
How does intensity compare to readmission rates on an episode and spell level? For example, do services with fewer bed days have more readmissions because people are being discharged too quickly? Are there any patterns to average length of stay per cluster? Is there any evidence that higher levels of stepping people down clusters or discharging leads to higher stepping up/re admission/re referral rates?
Do patients without a crisis plan require longer stays/re referrals/re
Links to other indicators admissions?
Do in-patient days vary by ethnicity?
C1 C2 C3 C4 C5 C6
C7 C7
C12 R2 R3 R6
R7
Direction of travel
No expected compliance % can currently be set. Consider local in-pt provision and crisis team practices to determine confidence in current levels of bed usage on a cluster basis.
Information as of June 2013
Overall performance across providers (all clusters)
Median Range
2.1% 0.0%-100%
50% providers achieve between
1.5%-3.2%
Overall performance by cluster:
Data quality limitations
8
10
11
12
13
14
15
16
4
5
6
7
0
1
2
3
17
18
19
20
21
Median
0.2%
0.7%
0.6%
0.6%
1%
2.4%
1%
1.2%
2.5%
3%
1.3%
3.1%
6.8%
21%
10.7%
4.3%
8.5%
0.2%
0.6%
2.1%
2.7%
Range
0-13.7%
0-100%
0-100%
0-74.2%
0-100%
0-100%
0-100%
0-100%
0-100%
0-100%
0-100%
0-100%
0-88.8%
0-70.3%
0-100%
0-99.2%
0-100%
0-100%
0-100%
0-43.8%
0-46.2%
50% providers patients spend between ....% of days in a bed
0-1.8%
0-1.5%
0-1.2%
0-1.1%
0.4-1.7%
1.4-4%
0.5-2.2%
0.6-2%
1.8-3.9%
2.1-4.7%
0.7-2%
2.2-4.7%
4.5-9.6%
13.5-33.8%
5-20.8%
2-6.8%
5.2-12.6%
0.1-0.4%
0.3-1.1%
1.6-4.1%
1.7-6.5%
The individual measures relating to this indicator include :
MM41-61 – Days on cluster [00] in RP
MM25 – Bed days less leave in RP
DCM 6 – Ward Stay Episodes
Published via http://www.hscic.gov.uk/


