career math quiz#7
advertisement
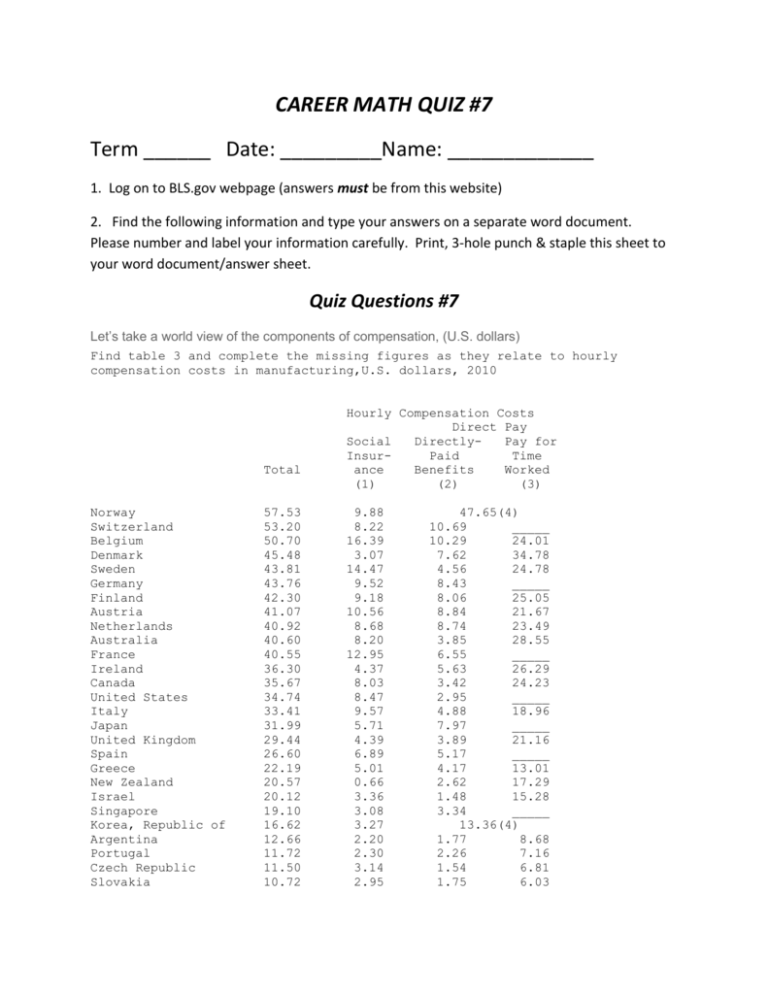
CAREER MATH QUIZ #7 Term ______ Date: _________Name: _____________ 1. Log on to BLS.gov webpage (answers must be from this website) 2. Find the following information and type your answers on a separate word document. Please number and label your information carefully. Print, 3-hole punch & staple this sheet to your word document/answer sheet. Quiz Questions #7 Let’s take a world view of the components of compensation, (U.S. dollars) Find table 3 and complete the missing figures as they relate to hourly compensation costs in manufacturing,U.S. dollars, 2010 Total Norway Switzerland Belgium Denmark Sweden Germany Finland Austria Netherlands Australia France Ireland Canada United States Italy Japan United Kingdom Spain Greece New Zealand Israel Singapore Korea, Republic of Argentina Portugal Czech Republic Slovakia 57.53 53.20 50.70 45.48 43.81 43.76 42.30 41.07 40.92 40.60 40.55 36.30 35.67 34.74 33.41 31.99 29.44 26.60 22.19 20.57 20.12 19.10 16.62 12.66 11.72 11.50 10.72 Hourly Compensation Costs Direct Pay Social DirectlyPay for InsurPaid Time ance Benefits Worked (1) (2) (3) 9.88 8.22 16.39 3.07 14.47 9.52 9.18 10.56 8.68 8.20 12.95 4.37 8.03 8.47 9.57 5.71 4.39 6.89 5.01 0.66 3.36 3.08 3.27 2.20 2.30 3.14 2.95 47.65(4) 10.69 _____ 10.29 24.01 7.62 34.78 4.56 24.78 8.43 _____ 8.06 25.05 8.84 21.67 8.74 23.49 3.85 28.55 6.55 _____ 5.63 26.29 3.42 24.23 2.95 _____ 4.88 18.96 7.97 _____ 3.89 21.16 5.17 _____ 4.17 13.01 2.62 17.29 1.48 15.28 3.34 _____ 13.36(4) 1.77 8.68 2.26 7.16 1.54 6.81 1.75 6.03 What is the dollar difference between Singapore and France? $_______ What is the dollar difference between Switzerland and Japan? $_______ Name the top three countries in terms of how much they pay for social insurance: _______________ , ____________________, ________________ . Name the top three countries in terms of directly paid benefits: ____________________ , ______________________, ____________________ . Now let’s look at the hourly compensation costs, (U.S. dollars) Find Table 1 and complete the missing figures as they relate to hourly compensation costs in manufacturing, U.S. dollars, and as a percent of costs in the United States Hourly Compensation Costs in U.S. dollars U.S.=100 1997 (1) 2010 1997 (1) 2010 Norway Switzerland Belgium Denmark Sweden Germany Finland Austria Netherlands Australia France Ireland Canada United States Italy Japan United Kingdom Spain Greece New Zealand Israel Singapore Korea, Republic of Argentina Portugal Czech Republic Slovakia Brazil Estonia Hungary Taiwan Poland Mexico Philippines 26.38 30.00 29.12 24.09 24.97 29.15 22.35 25.52 23.40 19.10 24.88 17.03 _____ 23.05 19.67 22.28 18.50 13.92 11.56 12.37 12.32 12.15 ____ 7.43 6.38 3.24 2.86 ____ NA 3.05 7.04 3.13 3.47 1.28 57.53 53.20 50.70 45.48 _____ 43.76 42.30 41.07 40.92 40.60 40.55 36.30 35.67 34.74 _____ 31.99 29.44 26.60 22.19 20.57 _____ 19.10 16.62 12.66 11.72 11.50 10.72 10.08 9.47 8.40 8.36 8.01 6.23 ____ 114 130 126 105 108 126 97 111 102 83 108 74 82 100 85 97 80 60 50 54 53 53 41 32 28 14 12 31 NA 13 31 14 15 6 166 153 146 131 126 126 122 118 118 117 117 ___ 103 100 96 92 85 __ 64 59 58 55 48 36 34 33 31 29 27 24 24 23 18 5 What is the monetary/compensation difference between Italy and Sweden? $ _________
