In class problems – some answers January 22, 2013 1) Find the
advertisement
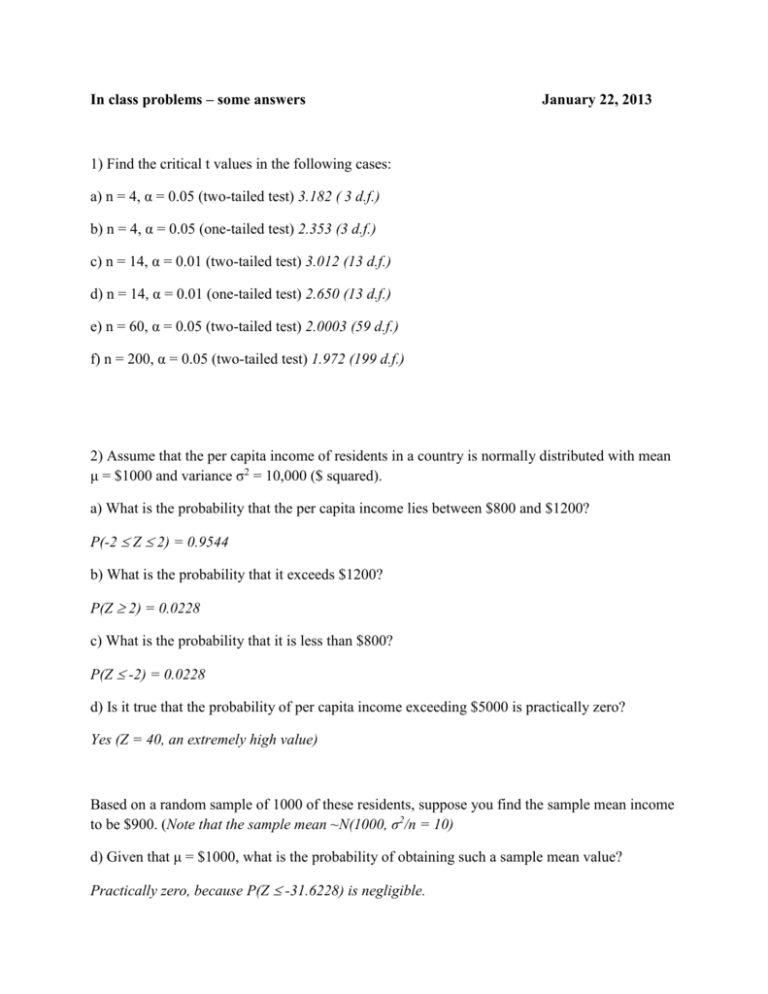
In class problems – some answers January 22, 2013 1) Find the critical t values in the following cases: a) n = 4, α = 0.05 (two-tailed test) 3.182 ( 3 d.f.) b) n = 4, α = 0.05 (one-tailed test) 2.353 (3 d.f.) c) n = 14, α = 0.01 (two-tailed test) 3.012 (13 d.f.) d) n = 14, α = 0.01 (one-tailed test) 2.650 (13 d.f.) e) n = 60, α = 0.05 (two-tailed test) 2.0003 (59 d.f.) f) n = 200, α = 0.05 (two-tailed test) 1.972 (199 d.f.) 2) Assume that the per capita income of residents in a country is normally distributed with mean μ = $1000 and variance σ2 = 10,000 ($ squared). a) What is the probability that the per capita income lies between $800 and $1200? P(-2 Z 2) = 0.9544 b) What is the probability that it exceeds $1200? P(Z 2) = 0.0228 c) What is the probability that it is less than $800? P(Z -2) = 0.0228 d) Is it true that the probability of per capita income exceeding $5000 is practically zero? Yes (Z = 40, an extremely high value) Based on a random sample of 1000 of these residents, suppose you find the sample mean income to be $900. (Note that the sample mean ~N(1000, σ2/n = 10) d) Given that μ = $1000, what is the probability of obtaining such a sample mean value? Practically zero, because P(Z -31.6228) is negligible. e) Based on the sample mean, establish a 95% confidence interval for μ and find out if this confidence interval includes μ = $1000. If it does not, what conclusions would you draw? The 95% confidence interval is: 893.8019 μx 906.1981 With 95% confidence we can say that the true mean is not equal to 1,000. f) Using the test of significance approach, decide whether you want to accept or reject the hypothesis that μ = $1000. What test did you use and why? Reject the null hypothesis. Use the normal distribution because the sample size is reasonably large. 3) You are told that X~N(μx = 8, σ2x = 36). Based on a sample of 25 observations, you found that the sample average = 7.5. a) What is the sampling distribution of the sample average? Xbar ~ N(8, 36/25) b) What is the probability of obtaining a sample average of 7.5 or less? Z = (7.5 – 8)/1.2 = -0.4167. Therefore, P(Z - 0.4167) = 0.3372. c) From your answer above, could such a sample value have come from the preceding population? The 95% CI for X = 8 ± 1.96(1.2) = (5.6480, 10.3520). Since this interval includes the value of 7.5, such a sample could have come from this population. 4) Let’s say profits (X) in an industry consisting of 100 firms are normally distributed with a mean value of $1.5 million. Suppose a random sample of 10 firms gave a mean profit of $900,000 and a (sample) standard deviation of $100,000. a) Establish a 95% confidence interval for the true mean profit in the industry. 900,000 ± 2.262(100,000/ √10 ), that is, (828,469, 971,531) b) Which probability distribution did you use? Why? The t distribution, since the true σ2 is not known. 5) Sixteen cars are first driven with a standard fuel and then with Petracoal, a gasoline with a methanol additive. The results of the nitrous oxide emissions (NOx) test are as follows: Type of fuel Standard Petracoal Average NOx 1.075 1.159 Standard dev. of NOx 0.5796 0.6134 a) How would you test the hypothesis that the two population standard deviations are the same? F =S12/S22 = 0.3762/0.3359 = 1.12. The p value of obtaining an F value of 1.12 or greater is 0.4146. Therefore, one cannot reject the null hypothesis that the two population variances are the same. b) Which test did you use? What are the assumptions underlying that test? The F test is used. The basic assumption is that the two populations are normal.

