Inventory Cost Reduction Simulation Report
James Postels
November 26, 2010
Professor R. Todd
Operations Management
Inventory Policy and Inventory Costs
Statement of Problem:
The reason for this report is to determine if there’s a better ordering policy for our company that can help reduce both the lost costs and totals costs. Using current policy, our inventory costs for a 90-day simulation ranges from $1.5 million to $2.5 million. The company’s unmet demand at times reaches nearly 1,150 units per day. From this unmet demand about 40% is from lost sales and backordered items. Our lost cost for each item is $150. Therefore, total lost sales, and backorders for the company can amount up to $31,481,250 if unmet demand is 1,150 units everyday for a year. This happening is rare occurrence but demonstrates why it’s important for our company to come up with a policy to manage our inventory efficiently.
Assumptions:
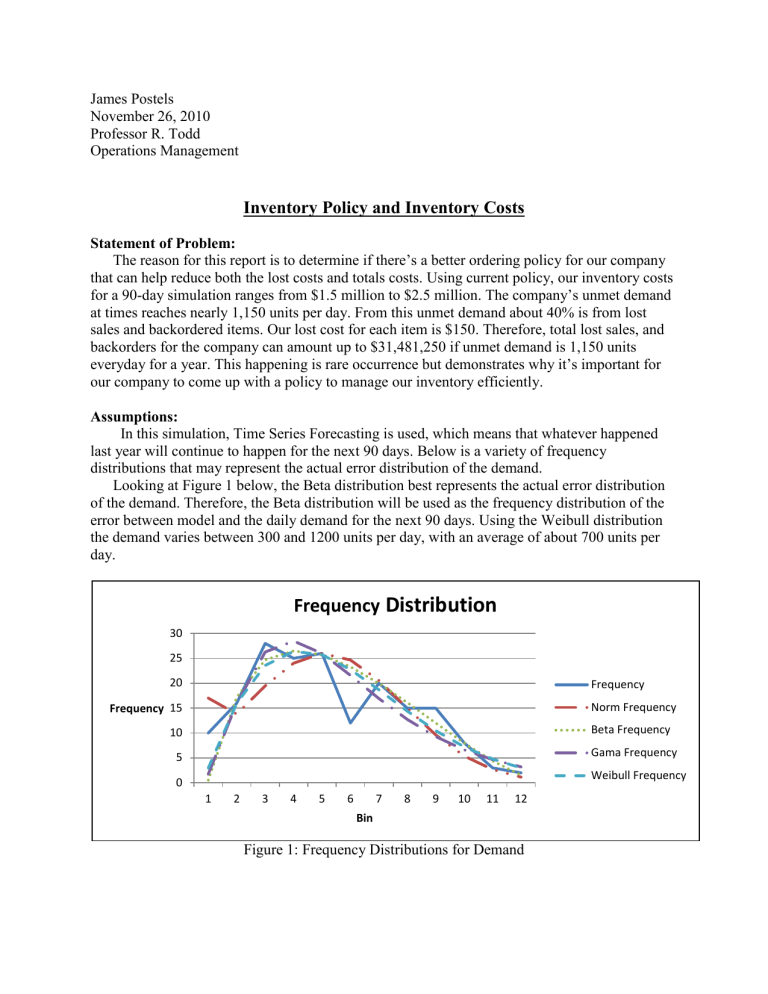
In this simulation, Time Series Forecasting is used, which means that whatever happened last year will continue to happen for the next 90 days. Below is a variety of frequency distributions that may represent the actual error distribution of the demand.
Looking at Figure 1 below, the Beta distribution best represents the actual error distribution of the demand. Therefore, the Beta distribution will be used as the frequency distribution of the error between model and the daily demand for the next 90 days. Using the Weibull distribution the demand varies between 300 and 1200 units per day, with an average of about 700 units per day.
Frequency
Distribution
Frequency 15
10
5
0
30
25
20 Frequency
Norm Frequency
Beta Frequency
Gama Frequency
Weibull Frequency
1 2 3 4 5 6 7 8 9 10 11 12
Bin
Figure 1: Frequency Distributions for Demand
For Lead time, the Weibull distribution and Beta distribution generate the smallest errors. As a result, the lead time generated by the inverse function of these two distributions will be more accurate for forecasting lead time. From these two distributions, Weibull is used because it best represents the actual error distribution of lead time.
In addition, the lead time ranges between 2 and 10 days with a mean of 7. The lead time frequency distributions are shown below in Figure 2.
Frequency Distribution
8
Frequency
6
4
14
12
10
2
0
Frequency
Beta Frequency
Gama Frequency
Weibull Frequency
1 2 3 4 5
Bins
6 7 8 9 10
Figure 2: Frequency Distributions for Lead Time
The following assumptions are provided by the accounting department and the marketing department. Below are estimates and actual data for the current inventory policy:
Open Quantity on Hand: 500 units
Unit Price: $100
Unit Cost: $50
Order Cost: $75/ order
EOQ: 612
ROP: 5332
Holding Costs Per Item: $2/ week
Backorder Fulfillment Cost: 15$/ item
Lost Cost Multiple: 3
Lost Costs: $150
Discussion and Results:
A company can obtain the lowest costs for inventory when they use the theoretical EOQ and ROP for ordering quantity and the reorder point. The EOQ is calculated by the formula below:
_ _
EOQ = √2D ∗ S/H = √2(65,027) ∗ 75/26 and ROP is calculated by 𝑑 ∗ 𝑙𝑡
D represents the daily average demand in the 90 days. S represents the ordering cost. lt represents the mean of lead time and H represents the annual holding cost per item. Based on the original data, EOQ is approximately 612, and ROP is about 5332.
Using the information in assumptions, a 90-day simulation, with 100 trails is developed. This was done to establish a feasible range of costs for the total costs. Looking at Graph 1 below one can see the simulation of our current inventory policy.
Frequency Distribution of Costs
Frequency 10
8
6
4
20
18
16
14
12
2
0
Frequency
Cumlative Relative
Frequency
100%
90%
80%
70%
60%
50%
40%
30%
20%
10%
0%
Total Costs
Graph 1: Current Inventory Policy
The graph above represents the following data:
Average Costs: $ 2 mil
Range of Costs: $1.6 mil to $2.7 mil
Simulation Period: 90 days
Graph 1 illustrates that there is 90 percent confidence proving that the total cost is below
$2.25 mil. However, this cost is high because our company’s lost in sales and backorders amount to 40% of unmet demand. As mentioned previously, for our current company policy, the re-order point is set at 5332 units and every time we place an order, our order quantity is 612 units. This policy can however be altered, to lower costs, and therefore increase profits.
Conclusion and Recommendation:
Our company can lower costs by “playing” with or altering its inventory policy. If the company increases its re-order point from 5332 to 7900 and increases its order quantity from 612 to 3500, costs will decrease. This is illustrated in Graph 2 below.
Frequency Distribution of Costs
Frequency
10
8
6
4
2
0
18
16
14
12
Frequency
Cumlative Relative
Frequency
60%
50%
40%
30%
100%
90%
80%
70%
20%
10%
0%
Total Costs
Graph 2: New Inventory Policy: ROP and Order Quantity Increased
In Graph 2 above, it’s noticeable that total costs have decreased by 2.2 million in a 90-day period. Furthermore, we can say with a 90% confidence that costs will be $420,000 or less. This new policy will reduce both lost sales and backorders by 16% (total 36%).
In addition, increasing the backorder percentage may yield lower lost sales, and decrease the company’s lost costs. Therefore, the effect of a backorder percentage increase with the new policy is demonstrated on the next page in Graph 3.
30
25
20
5
0
15
10
Frequency Distribution of Costs
Frequency
Cumlative Relative
Frequency
50%
40%
30%
20%
10%
0%
100%
90%
80%
70%
60%
Total Costs
Graph 3: New Inventory Policy with B/O% Increased
The graph above demonstrates that increasing backorder percentage by 30% have decreased costs from $540,000 to $420,000. However the company’s backorders have increased from 1% to 3% of unmet demand. However, this backorder increase has cut our company’s costs by
$120,000. There’s also a 95% confidence that costs will be $330,000 or less.
Finally the lead time varies between 2 and 10 days. However, if our company works with our suppliers to get orders to arrive between 6 and 8 days, this may further decrease our total lost costs. On the next page, a simulation is presented with lead time between 6 to 8 days, along with the new inventory policies adjusted above.
Frequency Distribution of Costs
Frequency
15
10
5
0
25
20
Frequency
Cumlative Relative
Frequency
Total Costs
Graph 4: New Inventory Policy, B/O: 80%, Lead-Time: 6 to 8 days
The graph presented above demonstrates that total costs have decreased from $450,000 to
$360,000. There is a 95% confidence that costs will be $310,000 or less. This increase has further decreased costs by $90,000.
In order to reduce inventory costs I would recommend that our company implement this new policy and change the reorder quantity to 3500 and reorder point to 7900 while also increasing the B/O %. In addition, work with suppliers to get deliveries within 6 to 8 days. This will reduce lost costs and increase profits for the company.
60%
50%
40%
30%
20%
10%
0%
100%
90%
80%
70%


