Word
advertisement
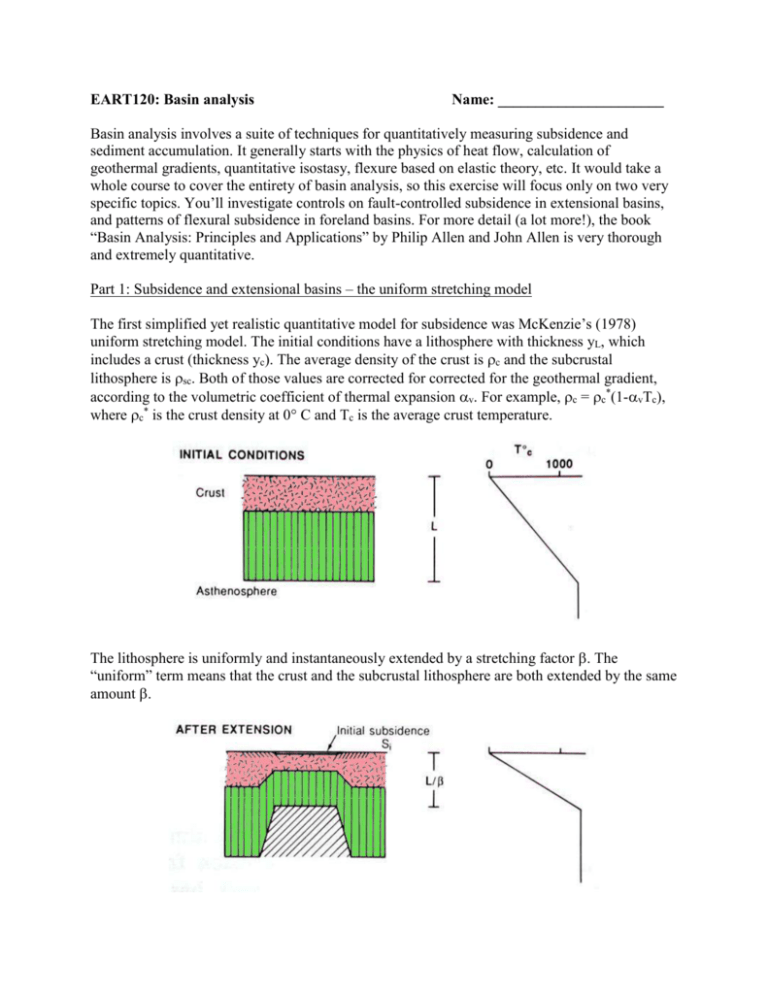
EART120: Basin analysis Name: ______________________ Basin analysis involves a suite of techniques for quantitatively measuring subsidence and sediment accumulation. It generally starts with the physics of heat flow, calculation of geothermal gradients, quantitative isostasy, flexure based on elastic theory, etc. It would take a whole course to cover the entirety of basin analysis, so this exercise will focus only on two very specific topics. You’ll investigate controls on fault-controlled subsidence in extensional basins, and patterns of flexural subsidence in foreland basins. For more detail (a lot more!), the book “Basin Analysis: Principles and Applications” by Philip Allen and John Allen is very thorough and extremely quantitative. Part 1: Subsidence and extensional basins – the uniform stretching model The first simplified yet realistic quantitative model for subsidence was McKenzie’s (1978) uniform stretching model. The initial conditions have a lithosphere with thickness yL, which includes a crust (thickness yc). The average density of the crust is c and the subcrustal lithosphere is sc. Both of those values are corrected for corrected for the geothermal gradient, according to the volumetric coefficient of thermal expansion v. For example, c = c*(1-vTc), where c* is the crust density at 0° C and Tc is the average crust temperature. The lithosphere is uniformly and instantaneously extended by a stretching factor . The “uniform” term means that the crust and the subcrustal lithosphere are both extended by the same amount . After doing an isostatic balance (the total mass of lithosphere in the column before stretching must equal the mass of stretched lithosphere plus the mass of water or sediment in the basin), the basin depth ys can be calculated: ∗ 𝑦𝐿 [(𝜌𝑚 𝑦𝑠 = − 𝑦 𝜌𝑐∗ ) 𝑐 𝑦𝐿 ∗ 𝑇𝑚 𝑦𝑐 𝛼𝑣 𝑇𝑚 𝜌𝑚 − 1⁄𝛽) (1 − 𝛼𝑣 2 𝑦 ) − 2 ] (1 𝐿 ∗ (1 − 𝛼 𝑇 ) − 𝜌 𝜌𝑚 𝑣 𝑚 𝑠 yL is the initial lithosphere thickness. Use 125 km (but note that it must be in m). yc is the initial crust thickness. You will vary this (it should be in m). m* is the density of the mantle at 0° C. Use 3300 kg m-3. c* is the density of the crust at 0° C. Use 2800 kg m-3. v is the volumetric coefficient of thermal expansion. Use 3.28x10⁻⁵ °C-1. Tm is the mantle temperature. Use 1333 °C. s is the density of the basin fill. You will vary this. is the stretching factor. You will vary this. The output ys will be positive for subsidence and negative for uplift (and will be measured in m). This is the fault-controlled subsidence or uplift only; thermal effects are neglected. If you want to know more about the derivation of this equation, see the Uniform Stretching handout at eCommons. Use Excel (or some other spreadsheet program) to set up the uniform stretching equation. In most spreadsheet programs, you write an equation starting with the equals sign (=) and selecting specific cells (the individual boxes) for input by writing their names (like A1 or B1) in the equation. For example, the text =A1 + B1 would add the values of cell A1 and cell B1 together. 1. Set the stretching factor to 1.5 (corresponding to a 50% extension of the lithosphere) and assume the basin is filled only with water with a density s of 1000 kg m-3. Vary the crustal thickness by setting yc to values of 10%, 20%, 30%, 40%, 50%, and 60% of the total lithosphere thickness yL. How does crustal thickness affect the rate of subsidence or uplift? Typical crustal thickness is 35 km. Does extension of typical crust lead to subsidence or uplift? 2. Using a crustal thickness of 35 km and assuming the basin is filled only with water with a density s of 1000 kg m-3, set the stretching factor to 1.2, 1.5, 2, and 4. How does the amount of extension affect the rate of subsidence or uplift? 3. Keep the crustal thickness at 35 km and set the stretching factor to 1.5, but assume that the basin is filled with sediment (density s of 2200 kg m-3) rather than water. How does this affect the amount of subsidence or uplift? Why does this difference occur? Part 2: Flexure and foreland basins The numeric calculations for flexure are complicated (involving fourth derivatives), so you’ll use a more qualitative approach with physical models. Take one of each diameter of wooden dowel (one narrow and one wide; there are only five of each, so you’ll have to work in groups or take turns). First, use the narrow dowel to draw a horizontal chalk line on the board, representing the pre-loading continental crust. 4. Hold the right side of the dowel in place and gently press down on the left end (mimicking the loading of a fold-and-thrust mountain belt). Don’t bend it too far – you could break the dowel! Trace the deformed position and then sketch (in your answer) the spatial distribution of subsidence or uplift. Don’t erase the chalk yet! 5. Shift the dowel horizontally about one-quarter length to the right, hold the right side in place and gently press down on the left end. Try to exert about the same force you did the first time. Draw the new deformed crust position on the chalk board. Where is the subsidence rate the highest? 6. Fold-and-thrust belts typically build toward the foreland, so the flexure of the underlying plate changes accordingly. Consider a point initially located far from the mountain front (beyond the right side of the dowel). How does accommodation space at that point change through time? Sketch the pattern graphically, with accommodation space on the horizontal axis and time (from oldest at the base to youngest at the top) on the vertical axis. 7. Next, use the wider dowel to draw a horizontal chalk line. Hold the right side in place a gently press down on the left end, using about the same force that you did previously. How does the flexural strength of the crust affect the amount of subsidence and the position of the forebulge uplift?
