Supplementary Information S1A.Densitometric analysis of MCM7
advertisement
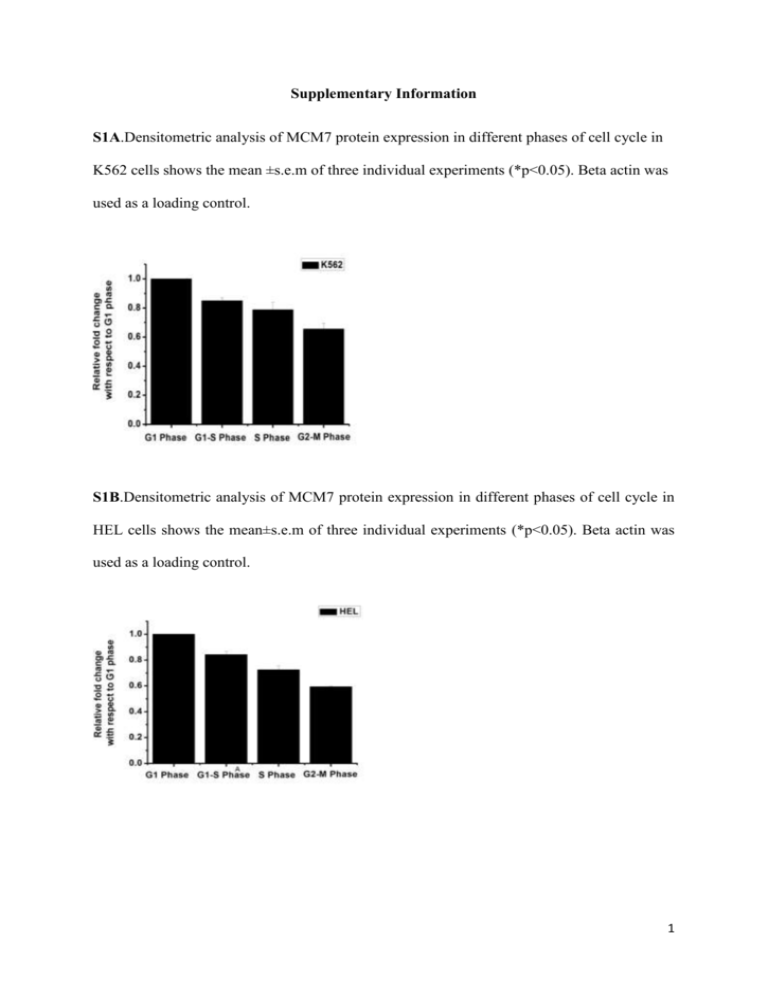
Supplementary Information S1A.Densitometric analysis of MCM7 protein expression in different phases of cell cycle in K562 cells shows the mean ±s.e.m of three individual experiments (*p<0.05). Beta actin was used as a loading control. S1B.Densitometric analysis of MCM7 protein expression in different phases of cell cycle in HEL cells shows the mean±s.e.m of three individual experiments (*p<0.05). Beta actin was used as a loading control. 1 S1C. Relative gene expression of MCM 7 at different phases of cell cycle normalised against HPRT1 as seen by qRT-PCR in CMK cells. Data represents the mean ± s.e.m of three independent experiments (*p<0.05, n=3). 2 S2A.Densitometric analysis of MCM7 protein expression normalised against coomassie stained membrane in HEL cells treated with TPA for the indicated time points in days. Data shows the mean±s.e.m of three individual experiments (*p<0.05, **p<0.01). S2B. MCM7 promoter activity during megakaryopoiesis in HEL cell as seen by Dual luciferase assay. Data represents the mean ± s.e.m of three independent experiments (*p<0.05, n=3). S2C.Relative gene expression of miR-17-92 cluster and miR-106a in ≥8N population when compared to 2N-4N population as seen by qRT-PCR in HEL cells. The relative expressions were normalised against HPRT1. Data represents the mean ± s.e.m of three independent experiments (*p<0.05, n=3). 3 S2D. In vitro megakaryocyte culture from cord blood derived CD34+ cells were characterized at day 0 and day 10 with anti CD61 and anti CD42b antibodies. The unilineage megakaryocyte cultures on day 10 were stained with vibrant orange. The polyploid population was sorted in a flow cytometer. S2E.Relative gene expression of MCM7 and miR-106b-25 cluster in in vitro megakaryocyte culture from cord blood derived CD34+ cells: ≥8N population was compared to 2N-4N population and analyzed by qRT-PCR in day 10. The relative expressions were normalised against HPRT1. Data represents mean ± s.e.m of three independent experiments (*p<0.05, n=3). 4 S2F.Relative gene expression of MCM7 and miR-106b-25 cluster in higher ploidy population compared to lower ploidy in CMK cells. The relative expressions were normalised against HPRT1. Data represents the mean ± s.e.m of three independent experiments (*p<0.05, n=3). S2G.Western blot of whole cell lysate of CMK cells treated with TPA showing the expression of MCM7. Densitometric analysis of MCM7 protein expression normalised against coomassie stained membrane. Data shows the mean ± s.e.m of three individual experiments (*p<0.05,). 5 S3A. Relative fold change in gene expression of MCM7 and miR-106b-25 cluster in mock and sh-UPF1 transfected TPA treated HEL cell as seen by qRT-PCR. The relative expressions were normalised against HPRT1. Data represents the mean ± s.e.m of three independent experiments (*p<0.01, n=3). S3B. Relative fold change of ratio between the amounts of larger transcript and both transcript as compared to TPA untreated HEL cells. Data represents the mean ± s.e.m of three independent experiments (*p<0.05, n=3). 6 S4A. CD61 marker analysis in mock and miR-106b transfected HEL cells. S4B. CD42b marker analysis in mock and miR-106b transfected HEL cells. HEL Transfected with Mock Median intensity value of CD61 (± SE) 8.03(±0.0208) miR-106b Transfected with P-value Mock 8.02(±0.0176) Median intensity value of CD42b (± SE) 193.74(±2.0069) miR-106b 195.84(±1.29) 0.0004 P-value 0.0032 0.0027 0.0001 7 S4C. CD61marker analysis in mock and miR-93 transfected HEL cells. HEL Transfected with Median intensity value of CD61 (± SE) P-value Mock 11.14(±0.0577) 0.0032 miR-93 11.75(±0.3724) 0.0375 8 S5A.Relative gene expression of megakaryopoietic lineage specific transcription factors in miR-25 transfected K562 cells as compared to mock transfected cells. Data represents the mean ± s.e.m of three independent experiments (*p<0.05, n=3) normalised against HPRT1. S5B. Relative gene expression of megakaryopoietic lineage specific transcription factors in anti-miR-25 transfected HEL cells as compared to scrambled siRNA transfected cells. Data represents the mean ± s.e.m of three independent experiments (*p<0.05, n=3) normalised against HPRT1. 9 S5C.Densitometric analysis of PTEN, phospho-Akt protein expression in mock and miR-25 containing vector transfected HEL and K562 cell line shows the mean±s.e.m of three individual experiments (p<0.03 for K562, p<0.01 for HEL). S5D.Densitometric analysis of PTEN protein expression in scrambled siRNA and anti miR25 transfected HEL and K562 cell line shows the mean ±s.e.m of three individual experiments (p<0.03). 10 S5E.Densitometric analysis of PTEN protein expression in HEL cells treated with TPA for the indicated time points in days shows the mean ± s.e.m of three individual experiments(p<0.01). S6A. Relative gene expression of miR-25 in miR-25 transfected HEL and K562 cells as compared to mock transfected cells. Data represents the mean ± s.e.m of three independent experiments (*p<0.05, n=3) normalised against HPRT1. 11 S6B. Relative gene expression of miR-25 in miR-25 nucleofected CD34+ cells as compared to mock transfected cells. Data represents the mean ± s.e.m of three independent experiments (*p<0.05, n=3) normalised against HPRT1. S6C. CD42b expression in HEL cells due to transfection of ‘mock’, ‘miR-25’, ‘PTEN’, ‘PTEN+miR-25’. ANOVA result: F value (156.6410); Fctitical value (4.0661). As the computed F exceeds the critical F, so it is inferred that there is a significant change in CD42b marker expression between the groups, and the four groups differ significantly (P<0.000001). 12
