Datasets and Matlab file directory
advertisement
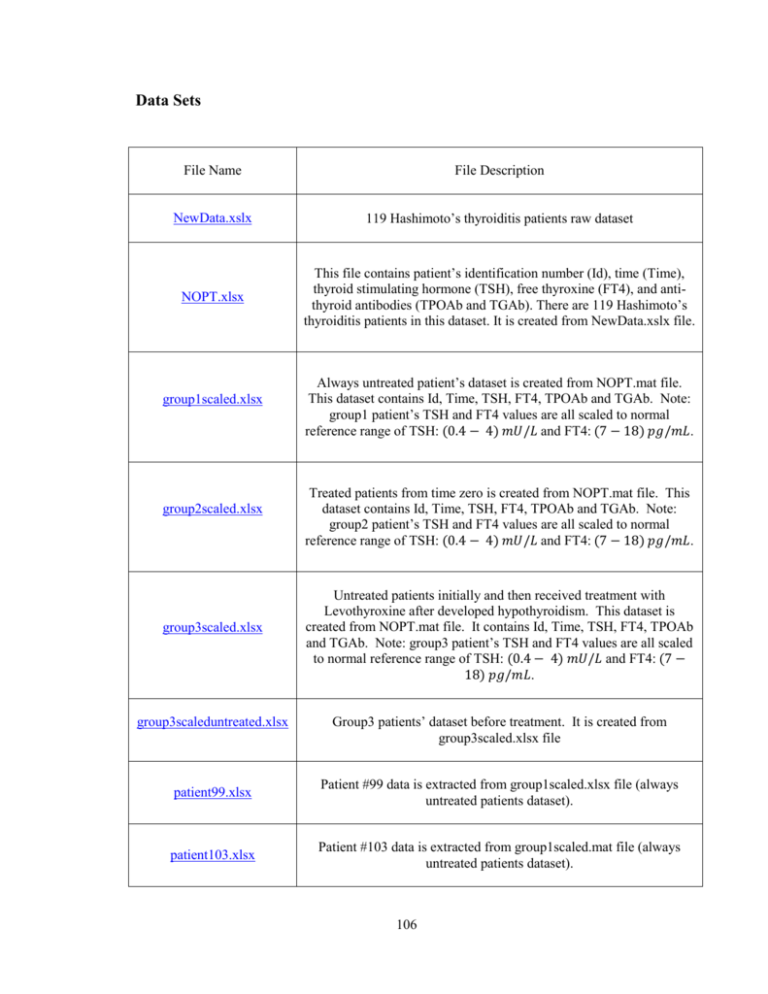
Data Sets File Name File Description NewData.xslx 119 Hashimoto’s thyroiditis patients raw dataset NOPT.xlsx This file contains patient’s identification number (Id), time (Time), thyroid stimulating hormone (TSH), free thyroxine (FT4), and antithyroid antibodies (TPOAb and TGAb). There are 119 Hashimoto’s thyroiditis patients in this dataset. It is created from NewData.xslx file. group1scaled.xlsx Always untreated patient’s dataset is created from NOPT.mat file. This dataset contains Id, Time, TSH, FT4, TPOAb and TGAb. Note: group1 patient’s TSH and FT4 values are all scaled to normal reference range of TSH: (0.4 − 4) 𝑚𝑈/𝐿 and FT4: (7 − 18) 𝑝𝑔/𝑚𝐿. group2scaled.xlsx group3scaled.xlsx Treated patients from time zero is created from NOPT.mat file. This dataset contains Id, Time, TSH, FT4, TPOAb and TGAb. Note: group2 patient’s TSH and FT4 values are all scaled to normal reference range of TSH: (0.4 − 4) 𝑚𝑈/𝐿 and FT4: (7 − 18) 𝑝𝑔/𝑚𝐿. Untreated patients initially and then received treatment with Levothyroxine after developed hypothyroidism. This dataset is created from NOPT.mat file. It contains Id, Time, TSH, FT4, TPOAb and TGAb. Note: group3 patient’s TSH and FT4 values are all scaled to normal reference range of TSH: (0.4 − 4) 𝑚𝑈/𝐿 and FT4: (7 − 18) 𝑝𝑔/𝑚𝐿. group3scaleduntreated.xlsx Group3 patients’ dataset before treatment. It is created from group3scaled.xlsx file patient99.xlsx Patient #99 data is extracted from group1scaled.xlsx file (always untreated patients dataset). patient103.xlsx Patient #103 data is extracted from group1scaled.mat file (always untreated patients dataset). 106 107 patient114.xlsx Patient #103 data is extracted from group3scaleduntreated.mat file. Matlab Files File Name File Description scatterplots.m This Matlab file contains codes for all scatter plots in Chapter 1. normal_operation.m This Matlab file contains codes for simulating the reduced 2d model in Chapter 3. norm_operation.m This Matlab file contains codes for simulating 3d model when Ab set to zero in Chapter 3. Disr_feed.m Using this Matlab file, one could generate all figures in Chapter 4. Note that 𝑘5 = 1 and 𝑘7 value changes for different arguments. bifurcation.m Using this file, one could generate all bifurcation diagrams in Chapter 4. euthyroid.m Using this file, one could generate euthyroidism → euthyroidism chart in Chapter 5. subclinicalhypo.m Using this file, one could generate euthyroidism → subclinical hypothyroidism chart and the parameterized curve (by 𝑘7 ) in Chapter 5. clinicalhypo.m Using this file, one could generate euthyroidism → subclinical → clinical hypothyroidism chart and the parameterized curve (by 𝑘7 ) in Chapter 5. completechart.m Using this file, one could generate the complete euthyroidism → subclinical → clinical hypothyroidism chart and the parameterized curve (by 𝑘7 ) in Chapter 5. patient103.m Using this file, one could generate patient #103 clinical chart and the curve in TSH- FT4 phase plane. 108 patient114.m Using this file, one could generate patient #114 clinical chart and the curve in TSH- FT4 phase plane.
