Microsoft Dynamics User Manual
advertisement

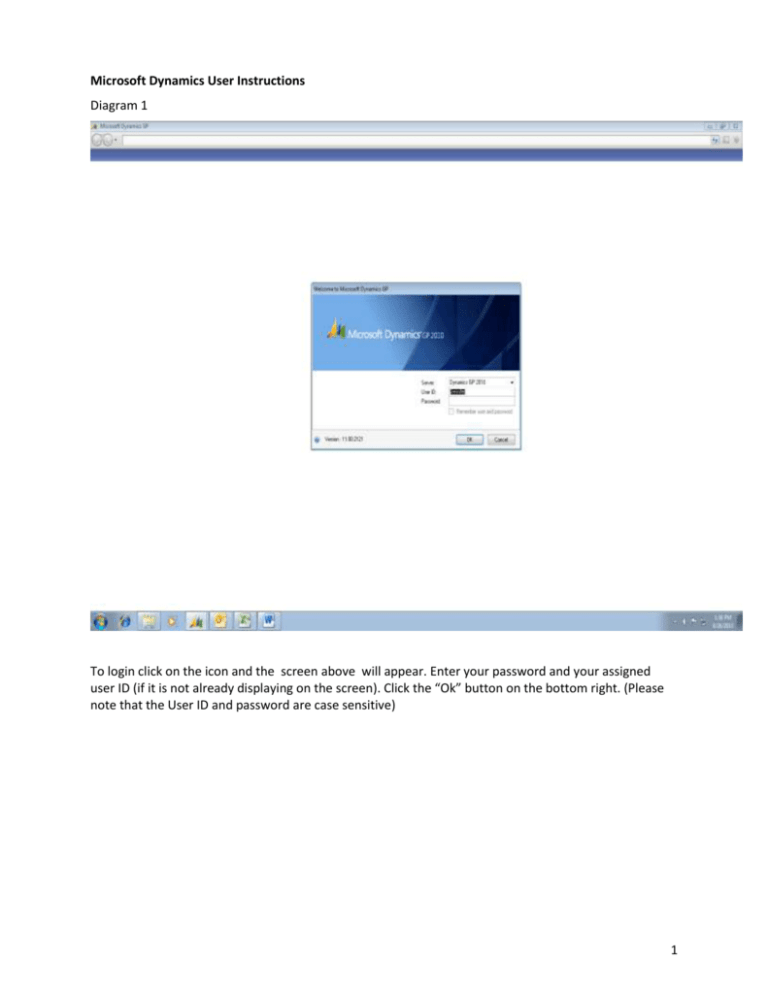
Microsoft Dynamics User Instructions Diagram 1 To login click on the icon and the screen above will appear. Enter your password and your assigned user ID (if it is not already displaying on the screen). Click the “Ok” button on the bottom right. (Please note that the User ID and password are case sensitive) 1 Diagram 2 Ensure that the company menu is selecting “Victoria University” and click on the “OK” button to proceed to the next screen (up to 10 Users can be logged on at any one time) 2 Diagram 3 User Preferences: On the left hand side of the screen click on “User Preferences” and the pop up screen above shown in Diagram 3 will come up. Entering data and navigating through Great Plains is done by hitting either the “Tab” key or the “Return” Key. Ensure that “Return” versus “Tab” is selected. This manual is prepared assuming that “Return” is your preference. If you prefer using “Tab” instead of “Return” you will need to click on “Tab”) 3 Diagram 4 Account Detail Inquiry: Select “Inquiry” from the menu at the top of the screen as shown on Diagram 4 select “Financial” from the options available to you and click on “Detail” 4 Diagram 5 The Diagram 5 screen will appear, key in the assigned account number that you’re interested in seeing in the upper left of the page right beside the word Account. After keying in the account number press “Return” and the account activity entered to date for that fiscal year will appear. Please note if you can’t remember the account number you can click on the little magnifying glass symbol beside the account entry field and a list of all existing accounts and corresponding assigned names will appear. Just scroll down and you can select the account you are interested in from the list. The number displayed next to the “Account Balance” is the total of all transaction charged to-date to that selected general ledger account. 5 Diagram 6 Diagram 7 6 Diagram 8 To see the descriptions you can use the blue arrow keys on the right hand side of the screen right beside the words Currency ID see Diagram 9. (To print click on the “Printer” icon top right of screen) You can search by date by selecting a date or date range. On the date line click on the “from” and either key in the date or pick the date from the calendar that appears. Pick an open and close date you are interested in and then click on the” Redisplay” button at the top of the screen 7 Diagram 9 Only transactions that have occurred in the selected date range will be displayed. To identify what type of entry has been charged you can click on the entry you are interested in. It will shade the whole entry in black then click on the Journal Entry (this is located middle of the screen on the left side above the entry you have clicked). This will allow you to see the journal entry. If this entry was the result of an invoice being paid you can verify the vendor by clicking on the Source Document on the top left of the Transaction Entry Zoom page 8 Diagram 10 Diagram 11 9 Diagram 12 10 Diagram 13 To look up prior years detail select “Inquiry” from the menu then select “Financial” and “History detail” see example on Diagram 13 11 Diagram 14 Again you will be asked to enter the account number. Or you can use the magnifying glass to search out the account you are interested in. Once it is entered choose the year you are interested in looking at from the drop down menu from the field beside the Year (over ten years is available please note that if you are interested in 2012-2013 year select 2013) 12 Printing Reports: Diagram 15 Select “Reports” from the menu at top of the screen select “Financial” and then “Trial Balance” 13 Diagram 16 You can create a new report or modify an existing report. Reports have been created for all budget holders for the monthly responsibility statements. The reports are by the budget holder’s last name and the reporting group (three digit code in the second grouping in the general ledger x-xxx-xxxx-xxx). You can select the one you are interested in running from the list 14 Diagram 17 Click “Modify” button and a similar screen to Diagram 17 will come up. Typically the only thing that you would change is the date you are running the report for. In the example below the month of May is going to be generated if that is what you are interested in. You can just press the “Destination” button at the bottom right hand corner to see if it is printing to the “Printer” “Screen” or “File”- you can pick any combination. You can print it to the screen and then select the “Print” button. 15 Diagram 18 In Diagram 18, we have selected to print to the screen. Click the “OK” button and then click on the “Print” button on the menu at the top of the screen (has a printer picture on the icon) 16 Diagram 19 This will result in a screen output of the trial balance you requested being printed similar to Diagram 19. If you now want a printed version just click on the “Print” icon on the screen output and it will print a hard copy to your printer. If you click on the “File” destination you can save an output of the report to Excel. 17 Diagram 20 To create New Report go to “Report”, “Financial” and “Trial Balance”. 18 Diagram 21 Click on “New” icon at the bottom of the screen shown on Diagram 21 and the screen will pop up. 19 Diagram 22 You will need to assign a name to your new report (even if you do not plan to save it) this is a mandatory field. You also need to click on the “Posting Accounts” tag top left. You can print from the current year or you can print historical year data. The default is the most recent current year. 20 Diagram 23 You can modify your report data by date, account and segment ID 21 Diagram 24 For example if you want to print the detail for a single account you would create the report as follows: select “Account” from the ranges field then in the “From to Range” enter in the account number. For this example below I have selected account 0-040-4100-010 (you can use the magnifying glass to search if you are not sure of the account number) Diagram 25 22 Diagram 26 Once you have picked the account you are interested in printing click on the “Insert” button (bottom left of the screen). You can also have the report subtotal the account information for you monthly. To do this use the drop down menu at the top right of the screen and select “Month” from the drop down menu. Click on the “Destination” button (bottom right of the screen) and to see where you are printing. In this example I am going to print to screen so I select “Screen” and ensure the other boxes are all unselected and click on the “Okay” button (see diagram below). 23 Diagram 27 To print click on the “Print” icon top middle of the page see below diagram 28 Diagram 28 24 Diagram 29 The report will print to the screen. You can print at this point to the printer if you wish by clicking on the “Print” button at the top of the printed screen report. You can also use the “Maximize” button top of the page to get the full screen view. To close the page click on the “red x” at the top of the print screen page. If you wish to save this report click the “Save” button at the top of the screen and it will save under the name you have assigned to it. 25 Diagram 30 For example if you want to print the food services account which is group 134 you would create the report as follows: select “Segment ID” for the ranges field then in the Segment ID field select “Segment2”. 26 Diagram 31 In the “From” “To” field select 134 (either type in 134 or select using the magnifying glass) 27 Diagram 32 Then click on the “Insert” button and click on “Destination” button to see where you are printing to. In this example “Screen” has been selected. 28 Diagram 33 Then click on the “Print” button at the top of the screen this will print all transaction to the 134 group of accounts from the fiscal year 2014 (If you wanted it to give monthly sub totals select “Month” from the “Subtotal by” menu top right side of the screen) Diagram 34 29 Diagram 35 If you want the same information for a previous year select the Year area “Field History” and select the year you want to run from the drop down menu and then press the “Print” icon Downloading Information to Excel Select “Report” “Financial” then “Trial Balance” click “New” in the options field. Create a name for your report, for this example we are calling it “test report”. Under include ensure that “Posting Accounts” box is clicked - select the account information you are interested in. In this example we are going to look at the restricted fund group segment 2 “216”. In the range field select “Segment ID” in the segment field choose the”Segment2” and insert the range from 216 to 216 and click “Insert” then click on the “Destination” button. Ensure that “File” is selected see diagram 30. Assign the file a name (we typed in test report) and ensure that you select “Comma Delimited File” as the file type from the menu see Diagram 37 below. 30 Diagram 36 Diagram 37 31 Click on the”File folder” symbol near file name and ensure that the file is being saved in the folder you wish it to be on your system. Click “Okay” and click on the “Print” button at the top of the screen. Then open Excel and open the file ensure that you are looking at “all files” not just excel files the system will assign csv extension to the file name you had selected in this case “test report.csv”. You will need to row format the columns after you open up the file Diagram 38 32 Diagram 39 33


