Schwab et al. MS2080491151562533-
advertisement
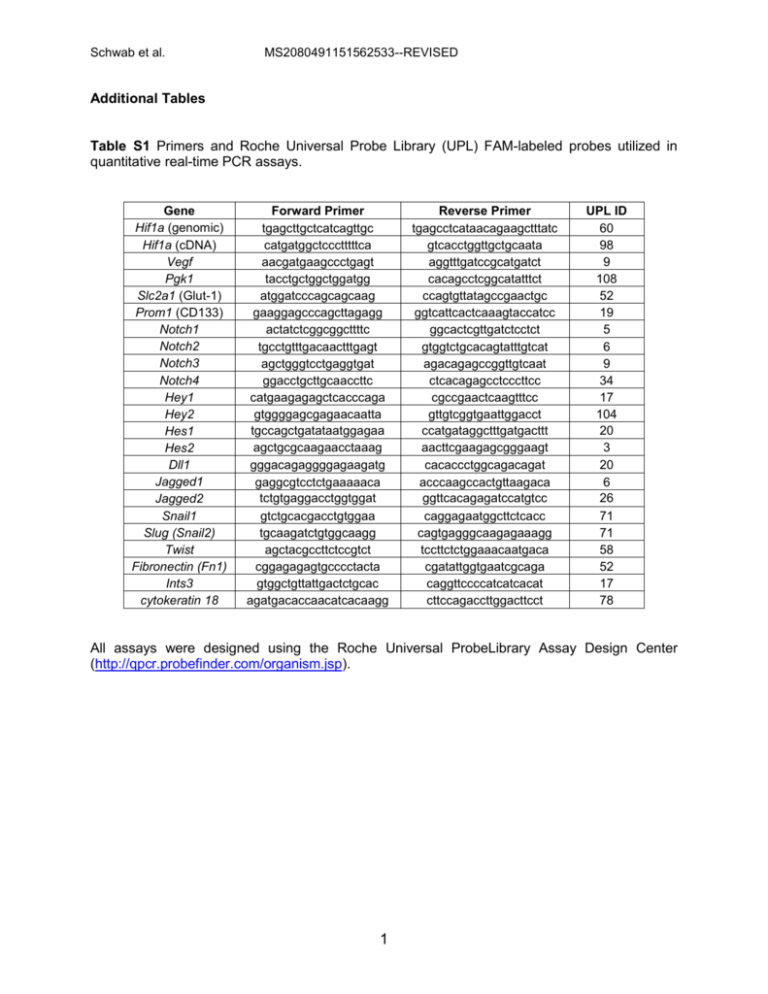
Schwab et al. MS2080491151562533--REVISED Additional Tables Table S1 Primers and Roche Universal Probe Library (UPL) FAM-labeled probes utilized in quantitative real-time PCR assays. Gene Hif1a (genomic) Hif1a (cDNA) Vegf Pgk1 Slc2a1 (Glut-1) Prom1 (CD133) Notch1 Notch2 Notch3 Notch4 Hey1 Hey2 Hes1 Hes2 Dll1 Jagged1 Jagged2 Snail1 Slug (Snail2) Twist Fibronectin (Fn1) Ints3 cytokeratin 18 Forward Primer tgagcttgctcatcagttgc catgatggctccctttttca aacgatgaagccctgagt tacctgctggctggatgg atggatcccagcagcaag gaaggagcccagcttagagg actatctcggcggcttttc tgcctgtttgacaactttgagt agctgggtcctgaggtgat ggacctgcttgcaaccttc catgaagagagctcacccaga gtggggagcgagaacaatta tgccagctgatataatggagaa agctgcgcaagaacctaaag gggacagaggggagaagatg gaggcgtcctctgaaaaaca tctgtgaggacctggtggat gtctgcacgacctgtggaa tgcaagatctgtggcaagg agctacgccttctccgtct cggagagagtgcccctacta gtggctgttattgactctgcac agatgacaccaacatcacaagg Reverse Primer tgagcctcataacagaagctttatc gtcacctggttgctgcaata aggtttgatccgcatgatct cacagcctcggcatatttct ccagtgttatagccgaactgc ggtcattcactcaaagtaccatcc ggcactcgttgatctcctct gtggtctgcacagtatttgtcat agacagagccggttgtcaat ctcacagagcctcccttcc cgccgaactcaagtttcc gttgtcggtgaattggacct ccatgataggctttgatgacttt aacttcgaagagcgggaagt cacaccctggcagacagat acccaagccactgttaagaca ggttcacagagatccatgtcc caggagaatggcttctcacc cagtgagggcaagagaaagg tccttctctggaaacaatgaca cgatattggtgaatcgcaga caggttccccatcatcacat cttccagaccttggacttcct UPL ID 60 98 9 108 52 19 5 6 9 34 17 104 20 3 20 6 26 71 71 58 52 17 78 All assays were designed using the Roche Universal ProbeLibrary Assay Design Center (http://qpcr.probefinder.com/organism.jsp). 1 Schwab et al. MS2080491151562533--REVISED Table S2 Primary antibody source and dilution factors utilized in western blotting, immunohistochemistry (IHC), immunofluorescence (IF) and FACS. Antibody anti-mouse HIF-1 anti-mouse Lamin A/C antianti-mouse Ki67 anti-mouse caspase3, active anti-mouse CD133PE anti-mouse CD133 anti-mouse ER anti-mouse p63 anti-mouse keratin 14 anti-mouse keratin 5 anti-mouse keratin 8 anti-mouse CD24FITC anti-mouse linage panel-biotin conjugated anti-mouse CD31biotin conjugate Secondary 1:50,000 anti-rabbit HRP 1:50,000 anti-goat HRP Source (Catalog #) Novus Biologicals (NB100479, Lots E2 or M1) Santa Cruz Biotechnology (sc-6215) Dilution Purpose 1:5,000 western 1:1,000 western Sigma-Aldrich (A5228) Santa Cruz Biotechnology (sc-7846) 1:5,000 western 1:50,000 anti-mouse HRP 1:500 IHC 1:200; Vector Elite kit R&D Systems (AF835) 1:750 1:100 1:200 IHC FACS IF 1:200; Vector Elite kit eBiosciences (clone AC133) N/A 1:500 AlexaFluor488 or 594 1:200; Vector Elite kit Millipore (clone 13A4) Santa Cruz Biotechnology (sc-542) Abcam (ab53039) Covance (clone AF64) Abcam (ab52635) DSHB (Troma-1) 1:50 IF 1:10,000 1:20,000 1:750 1:100 1:20 IHC IHC IF IF IF BD Biosciences (553261) 1:100 FACS BD Pharmingen (559971) 1:100 FACS N/A SA-APC (BD Pharmingen 554067) BD Pharmingen (553371) 1:100 FACS SA-APC 2 1:200; Vector Elite kit 1:500 AlexaFluor594 1:500 AlexaFluor594 1:500 AlexaFluor488 Schwab et al. MS2080491151562533--REVISED Table S3 Frequency of tumors in recipient mice at day 62 after limiting dilution transplantation. _________________________________________________________________________________________ Day 62 Post-Transplant Genotype of MTECs Number of cells injected HIF-1 WT HIF-1 KO Tumor-positive Tumor-positive Fisher’s exact test 100 50 25 10 92% (12/13) 88% (14/16) 70% (14/20) 78% (18/23) 50% (7/14) 19% (3/16) 15% (3/20) 9% (2/22) N.S. p= 0.0002 p= 0.0011 p< 0.0001 Estimated TIC freq. by ELDA (95% C.I.) HIF-1 WT HIF-1 KO Chi-square test 1/18 (1/13-1/26) 1/135 (1/84-1/217) p= 3.96e-14 _________________________________________________________________________________________ A Fisher’s exact (Chi-square) test was utilized to compare significance of tumor-initiating potential between WT and KO cells at each cell density (N.S., not significant). The estimated TIC frequency at day 62 post-transplant was determined by ELDA software. Table S4 Frequency of tumors in recipient mice at day 112 after limiting dilution transplantation. _________________________________________________________________________________________ Day 112 post-transplant Genotype of MTECs Number of cells injected HIF-1 WT HIF-1 KO Tumor-positive Tumor-positive Fisher’s exact test * 100 50 25 10 100% (13/13) 94% (15/16) 95% (19/20) 96% (22/23) 100% (14/14) 94% (15/16) 50% (10/20) 45% (10/22) test not appropriate N.S. p= 0.0011 p< 0.0001 * ELDA analysis could not estimate TIC frequency with a 95% CI based on these data _________________________________________________________________________________________ A Fisher’s exact (Chi-square) test was utilized to compare TIC potential between WT to KO cells at each cell density. Data for the 10 and 25 cell input groups remain statistically significant, whereas no significant differences (N.S.) were observed between WT and KO cells for the 50 cell input groups. The Chi-square test is no longer appropriate for the 100 cell input group, as all recipient mice bearing WT or KO tumor cells had developed measurable tumors by day 112. 3 Schwab et al. MS2080491151562533--REVISED Table S5 Summary of the percentage and total number of recipients bearing small tumors at day 112 post-transplant. GenotypeCell density WT- 100 KO- 100 WT- 50 KO- 50 WT- 25 KO- 25 WT- 10 KO- 10 % tumor-positive recipients with tumor <250mm3 0% (0/13) 7% (1/14) 0% (0/15) 13.3% (2/15) 5.2% (1/19) 20% (2/10) 9% (2/22) 60% (6/10) Table S6 Frequency of tumors in recipient mice at day 244 after limiting dilution transplantation. _________________________________________________________________________ Day 244 Post-Transplant Genotype of MTECs Number of cells injected HIF-1 WT HIF-1 KO Tumor-positive Tumor-positive Fisher’s exact test * 50 25 10 100% (16/16) 100% (20/20) 96% (22/23) 100% (16/16) 95% (19/20) 73% (16/22) test not appropriate N.S. p< 0.047 * ELDA analysis could not estimate TIC frequency with a 95% CI based on these data ______________________________________________________________________ A Fisher’s exact test was utilized to compare significance of tumor-initiating potential between WT to KO cells for the 10 and 25 cell input groups. The Chi-square test is no longer appropriate for the 50 cell input group, as all recipient mice bearing WT or KO tumor cells had developed measurable tumors by day 244. 4 Schwab et al. MS2080491151562533--REVISED Table S7 Summary of the percentage and total number of recipients bearing small tumors at day 244 post-transplant. Genotype-Cell density WT- 50 KO- 50 WT- 25 KO- 25 WT- 10 KO- 10 % of tumor-positive recipients with tumors < 250mm3 0% (0/16) 0% (0/16) 0% (0/20) 10.5% (2/19) 0% (0/22) 37.5% (6/16) 5
