Microsoft Word Version
advertisement
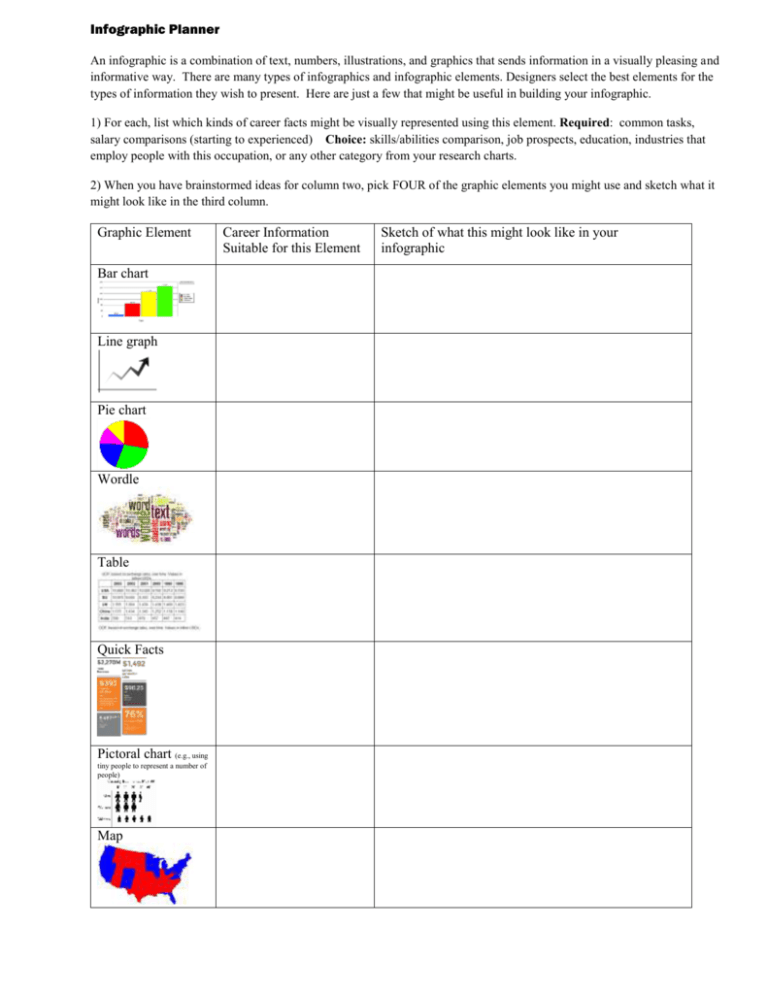
Infographic Planner An infographic is a combination of text, numbers, illustrations, and graphics that sends information in a visually pleasing and informative way. There are many types of infographics and infographic elements. Designers select the best elements for the types of information they wish to present. Here are just a few that might be useful in building your infographic. 1) For each, list which kinds of career facts might be visually represented using this element. Required: common tasks, salary comparisons (starting to experienced) Choice: skills/abilities comparison, job prospects, education, industries that employ people with this occupation, or any other category from your research charts. 2) When you have brainstormed ideas for column two, pick FOUR of the graphic elements you might use and sketch what it might look like in the third column. Graphic Element Bar chart Line graph Pie chart Wordle Table Quick Facts Pictoral chart (e.g., using tiny people to represent a number of people) Map Career Information Suitable for this Element Sketch of what this might look like in your infographic
