Spectra-SA2-Sept2012
advertisement
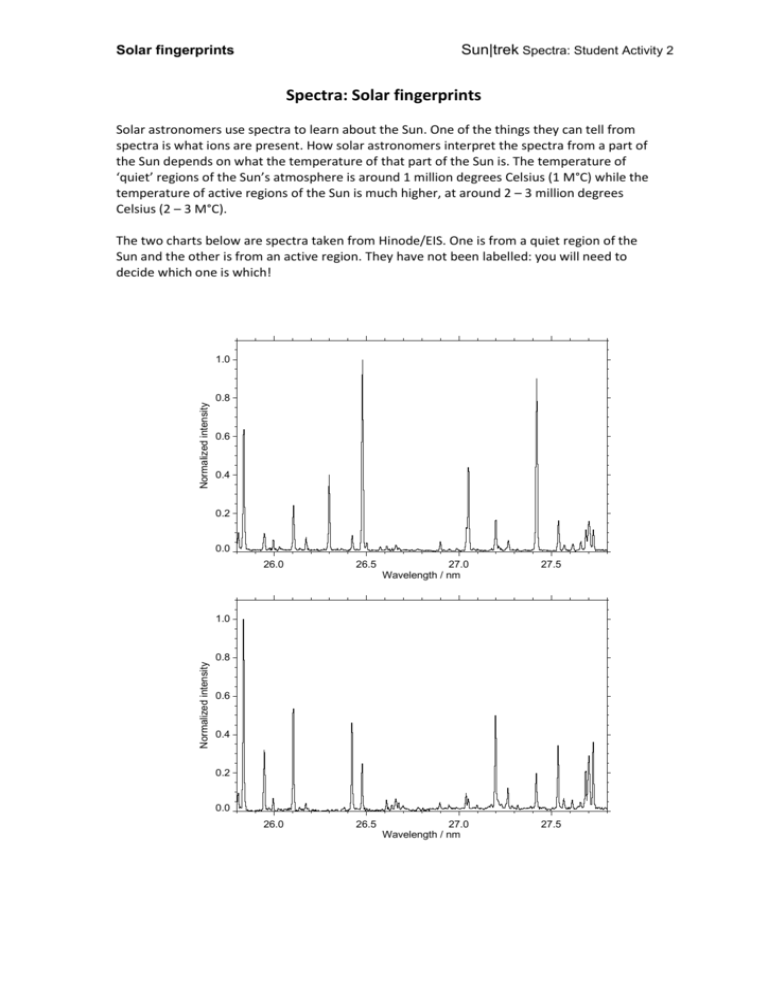
Sun|trek Spectra: Student Activity 2 Solar fingerprints Spectra: Solar fingerprints Solar astronomers use spectra to learn about the Sun. One of the things they can tell from spectra is what ions are present. How solar astronomers interpret the spectra from a part of the Sun depends on what the temperature of that part of the Sun is. The temperature of ‘quiet’ regions of the Sun’s atmosphere is around 1 million degrees Celsius (1 M°C) while the temperature of active regions of the Sun is much higher, at around 2 – 3 million degrees Celsius (2 – 3 M°C). The two charts below are spectra taken from Hinode/EIS. One is from a quiet region of the Sun and the other is from an active region. They have not been labelled: you will need to decide which one is which! Normalized intensity 1.0 0.8 0.6 0.4 0.2 0.0 26.0 26.5 27.0 Wavelength / nm 27.5 26.0 26.5 27.0 Wavelength / nm 27.5 Normalized intensity 1.0 0.8 0.6 0.4 0.2 0.0 Sun|trek Spectra: Student Activity 2 Solar fingerprints The table below shows the wavelengths of light produced by different ions in the wavelength range being studied. The spectra show the intensity (brightness) of light at each wavelength: the taller the peak, the greater the intensity of the light emitted at that wavelength. The peaks are higher because the light intensity is greater when there are more of the ions that are emitting that wavelength of light. The temperatures in the right hand column show the temperature at which a tall peak appears for that wavelength. Notice that there can be several lines for the same ion. Ion Si10+ Si10+ Fe16+ S10+ Fe14+ Mg6+ Fe14+ Si10+ Fe14+ Si7+ Wavelength (nm) 25.837 26.106 26.298 26.428 26.479 27.040 27.052 27.199 27.420 27.537 Temperature (M°C) 1.41 1.41 2.82 1.41 2.00 0.45 2.00 1.41 2.00 0.63 Questions 1. Look at the spectra. What is the range of wavelengths being studied in the spectra? 2. What part of the electromagnetic spectrum does this correspond to? 3. Look at the left hand column of the table. How many electrons have been lost from a magnesium atom to produce an Mg6+ ion? 4. What is the temperature at which Mg6+ ions are produced most strongly? What about Si 10+? 5. Which ions are produced most strongly at 2 M°C or above? 6. Identify the peaks associated with each ion from the table on the two spectra. 7. Label the peaks that identify one of the spectrum plots as the one from an active region. 8. Which plot is the ‘quiet region’ spectrum and which is the ‘active region’ spectrum?

