Stat 5511
advertisement

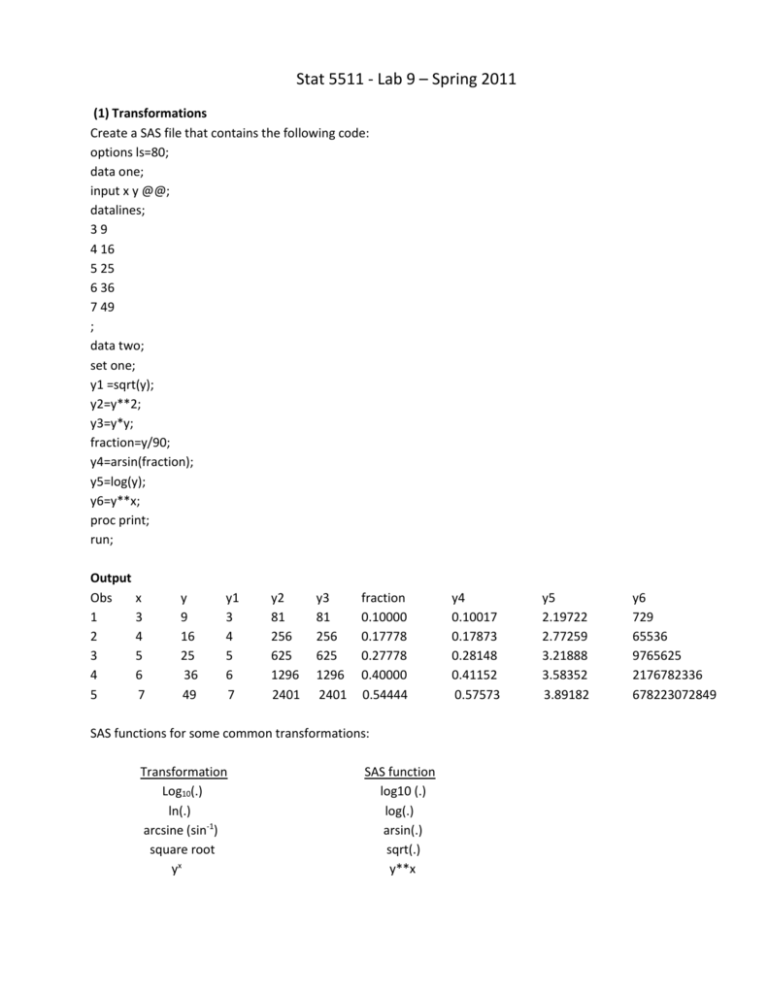
Stat 5511 - Lab 9 – Spring 2011 (1) Transformations Create a SAS file that contains the following code: options ls=80; data one; input x y @@; datalines; 39 4 16 5 25 6 36 7 49 ; data two; set one; y1 =sqrt(y); y2=y**2; y3=y*y; fraction=y/90; y4=arsin(fraction); y5=log(y); y6=y**x; proc print; run; Output Obs x 1 3 2 4 3 5 4 6 5 7 y 9 16 25 36 49 y1 3 4 5 6 7 y2 81 256 625 1296 2401 y3 81 256 625 1296 2401 fraction 0.10000 0.17778 0.27778 0.40000 0.54444 SAS functions for some common transformations: Transformation Log10(.) ln(.) arcsine (sin-1) square root yx SAS function log10 (.) log(.) arsin(.) sqrt(.) y**x y4 0.10017 0.17873 0.28148 0.41152 0.57573 y5 2.19722 2.77259 3.21888 3.58352 3.89182 y6 729 65536 9765625 2176782336 678223072849 (2) Polynomial Regression Model Create a poly.dat with the following data came from U.S. Census Bureau(Finite Mathematics + Applied Calculus p.1020): 0 847 1 907 2 1016 3 1110 4 1251 5 1340 6 1134 7 1043 8 773 9. Create a SAS file that contains the following code: options ls=80; data one; infile 'poly.dat’; input x1 y; x2=x1*x1; run; proc reg data=one; model y=x1 x2/ss1 r clb; /*Create a model y 0 1 x1 2 x1 .*/ test x2=0; /*Test H0: 2 0 */ run; proc print; run; proc plot data=one; plot y*x1; plot y*x2; run; 2 /* optional you can see your data*/ The scatter diagram suggests that the quadratic model may describe the relationship between x and y.