docx - Tsinghua Math Camp 2015
advertisement
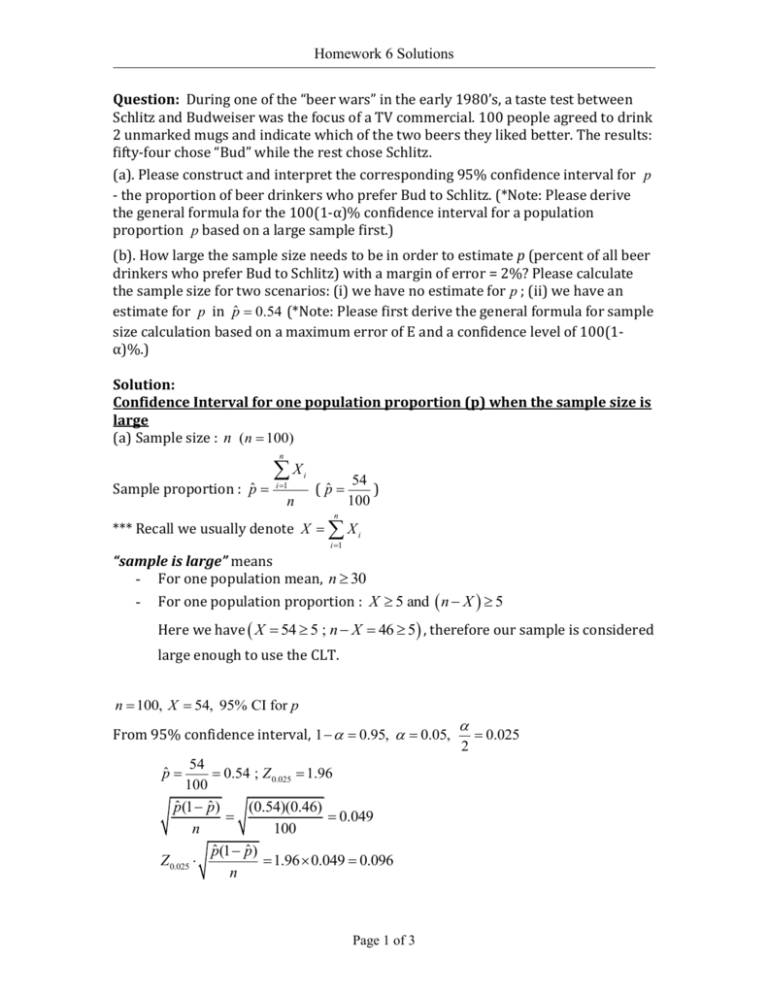
Homework 6 Solutions Question: During one of the “beer wars” in the early 1980’s, a taste test between Schlitz and Budweiser was the focus of a TV commercial. 100 people agreed to drink 2 unmarked mugs and indicate which of the two beers they liked better. The results: fifty-four chose “Bud” while the rest chose Schlitz. (a). Please construct and interpret the corresponding 95% confidence interval for p - the proportion of beer drinkers who prefer Bud to Schlitz. (*Note: Please derive the general formula for the 100(1-α)% confidence interval for a population proportion p based on a large sample first.) (b). How large the sample size needs to be in order to estimate p (percent of all beer drinkers who prefer Bud to Schlitz) with a margin of error = 2%? Please calculate the sample size for two scenarios: (i) we have no estimate for p ; (ii) we have an estimate for p in pˆ 0.54 (*Note: Please first derive the general formula for sample size calculation based on a maximum error of E and a confidence level of 100(1α)%.) Solution: Confidence Interval for one population proportion (p) when the sample size is large (a) Sample size : n ( n 100) n Sample proportion : pˆ X i 1 n i ( pˆ 54 ) 100 n *** Recall we usually denote X X i i 1 “sample is large” means - For one population mean, n 30 - For one population proportion : X 5 and n X 5 Here we have X 54 5 ; n X 46 5 , therefore our sample is considered large enough to use the CLT. n 100, X 54, 95% CI for p From 95% confidence interval, 1 0.95, 0.05, 54 0.54 ; Z 0.025 1.96 100 pˆ (1 pˆ ) (0.54)(0.46) 0.049 n 100 pˆ (1 pˆ ) Z0.025 1.96 0.049 0.096 n pˆ Page 1 of 3 2 0.025 Homework 6 Solutions The 95% confidence interval for p is 0.444,0.636 Therefore, based on the given study, the percentage of people who prefer Bud versus Schlitz could be either below 0.5 or larger than 0.5. It is inconclusive based on the given confidence interval to decide which beer is more liked. (b) Sample size calculation for p based on the maximum error E. Definition. P( pˆ p E) 1 We want to estimate p within E with a probability of (1 ) . Note: The maximum error E for 𝛂 = 𝟎. 𝟎𝟓 is also referred to as the margin of error. Derive the formula for n P(|p̂ − p| ≤ E) = 1 − α P(−E ≤ p̂ − p ≤ E) = 1 − α E P − ≤ p̂ − p E ≤ √p(1 − p) √p(1 − p) √p(1 − p) ( ) n n n Since when the sample size is large, by the CLT we have: p̂ − p Z= ~̇N(0,1) p(1 − p) √ n Thus P − E √p(1 − p) ( n ≤Z≤ E √p(1 − p) ) n = 1−α = 1−α E (i) (ii) = Zα/2 p(1 − p) √ n 2 (Zα/2 ) p(1 − p) ∴n= E2 If we can obtain some information about p (for example a previous study), we can plug in the estimate of p, p̂, and obtain the following formula: 2 (Zα/2 ) p̂(1 − p̂) n= E2 If there is no information on p, since p(1 − p) is maximized when p = 1/2, we can use the following conservative estimator: 2 (Zα/2 ) n= 4E 2 Now for the given problem, the margin of error is indeed the maximum error when 𝜶 = 𝟎. 𝟎𝟓 Page 2 of 3 Homework 6 Solutions Here the margin of error = E = 0.02, and 𝛼 = 0.05. Therefore we have (i) when we do not have an estimate for p, we use the conservative formula: (𝒁𝟎.𝟎𝟐𝟓 )𝟐 (𝟏. 𝟗𝟔)𝟐 𝒏= = = 𝟐𝟒𝟎𝟏 𝟒𝑬𝟐 𝟒(𝟎. 𝟎𝟐)𝟐 (ii) when we use p̂ = 0.54, the required sample size is: (𝒁𝟎.𝟎𝟐𝟓 )𝟐 𝟎. 𝟓𝟒(𝟏 − 𝟎. 𝟓𝟒) 𝒏= = 𝟐𝟑𝟖𝟔 (𝟎. 𝟎𝟐)𝟐 Page 3 of 3


