Adulteration in Milk
advertisement
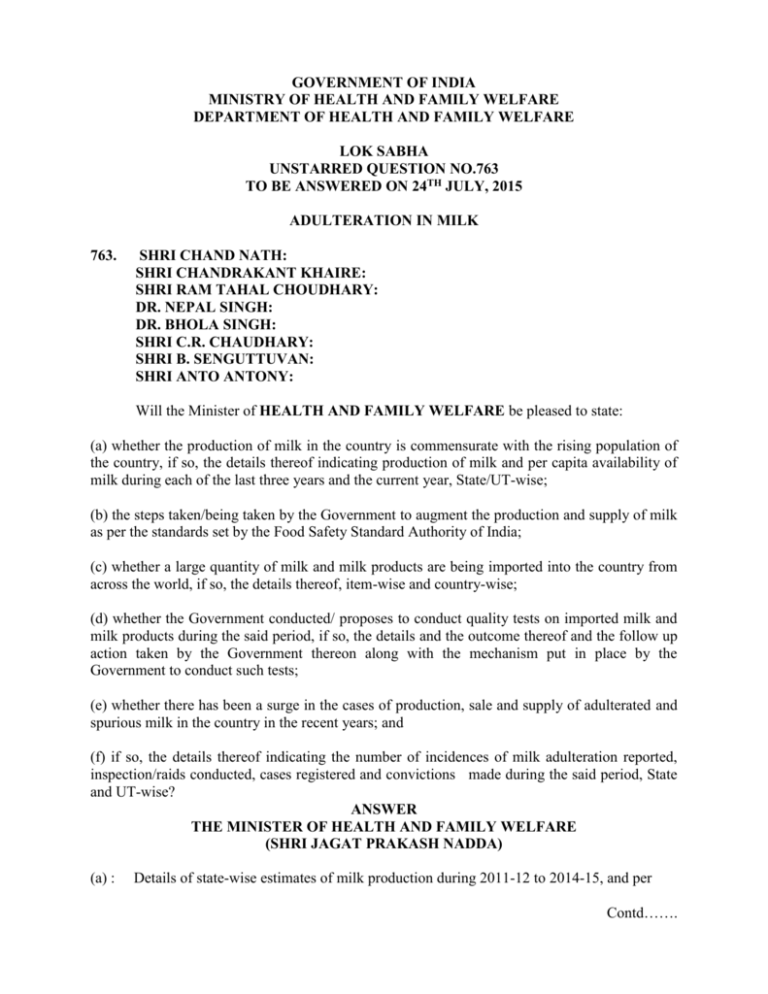
GOVERNMENT OF INDIA MINISTRY OF HEALTH AND FAMILY WELFARE DEPARTMENT OF HEALTH AND FAMILY WELFARE LOK SABHA UNSTARRED QUESTION NO.763 TO BE ANSWERED ON 24TH JULY, 2015 ADULTERATION IN MILK 763. SHRI CHAND NATH: SHRI CHANDRAKANT KHAIRE: SHRI RAM TAHAL CHOUDHARY: DR. NEPAL SINGH: DR. BHOLA SINGH: SHRI C.R. CHAUDHARY: SHRI B. SENGUTTUVAN: SHRI ANTO ANTONY: Will the Minister of HEALTH AND FAMILY WELFARE be pleased to state: (a) whether the production of milk in the country is commensurate with the rising population of the country, if so, the details thereof indicating production of milk and per capita availability of milk during each of the last three years and the current year, State/UT-wise; (b) the steps taken/being taken by the Government to augment the production and supply of milk as per the standards set by the Food Safety Standard Authority of India; (c) whether a large quantity of milk and milk products are being imported into the country from across the world, if so, the details thereof, item-wise and country-wise; (d) whether the Government conducted/ proposes to conduct quality tests on imported milk and milk products during the said period, if so, the details and the outcome thereof and the follow up action taken by the Government thereon along with the mechanism put in place by the Government to conduct such tests; (e) whether there has been a surge in the cases of production, sale and supply of adulterated and spurious milk in the country in the recent years; and (f) if so, the details thereof indicating the number of incidences of milk adulteration reported, inspection/raids conducted, cases registered and convictions made during the said period, State and UT-wise? ANSWER THE MINISTER OF HEALTH AND FAMILY WELFARE (SHRI JAGAT PRAKASH NADDA) (a) : Details of state-wise estimates of milk production during 2011-12 to 2014-15, and per Contd……. -2Capita availability of milk during the said period are indicated in Annexure-I and Annexure-II respectively. (b): The Department of Animal Husbandry, Dairying and Fisheries is implementing National Dairy Plan-I, National Programme for Bovine Breeding and Dairy Development, and Dairy Entrepreneurship Development Programme to augment milk production in the country. (c): As per the data compiled through Food Import Clearance System (FICS), the quantity of milk and milk products imported during last three years and the current year is indicated in Annexure-III. (d): The imported consignments referred to the Food Safety and Standards Authority of India (FSSAI) for clearance by the Custom Authorities are subjected to inspection and sampling by Authorised Officers of FSSAI, who also send the sample to Food analyst of notified laboratory. (e) & (f): Cases of adulteration of milk have come to the notice of FSSAI. The Commissioners of Food Safety throughout the country have repeatedly been urged to ensure strict enforcement of standards of milk and milk products. As per the information made available by State/UT Governments, the details of samples of milk collected, tested, found not conforming and action taken in such cases is indicated in Annexure-IV. ………… Annexure-I ESTIMATES OF MILK PRODUCTION DURING 2011-12 TO 2014-15 (000 tonnes) S. No. States/UTs 1 Andhra Pradesh 2 Arunachal Pradesh 3 2011-12 2012-13 2013-14 2014-15 12087.65 12761.65 13007.08 9656.15 21.99 22.72 43.35 46.07 Assam 796.40 799.67 814.52 829.47 4 Bihar 6643.00 6844.84 7197.06 7774.89 5 Chhattisgarh 1119.14 1164.05 1208.61 1231.57 6 Goa 60.02 61.24 67.81 66.60 7 Gujarat 9816.51 10314.63 11112.18 11690.57 8 Haryana 6661.04 7040.24 7441.67 7901.35 9 Himachal Pradesh 1119.85 1138.60 1150.81 1172.16 10 Jammu & Kashmir 1614.43 1630.56 1614.67 1950.93 11 Jharkhand 1744.87 1679.00 1699.83 1733.72 12 Karnataka 5447.28 5718.22 5997.03 6120.93 13 Kerala 2716.27 2790.58 2654.70 2711.13 14 Madhya Pradesh 8149.45 8837.79 9599.20 10779.07 15 Maharashtra 8468.93 8733.69 9089.03 9542.29 16 Manipur 78.61 80.03 81.70 82.17 17 Meghalaya 79.00 80.52 82.16 82.96 18 Mizoram 13.91 13.63 15.30 20.49 19 Nagaland 78.00 78.66 80.61 75.69 20 Odisha 1723.54 1724.40 1861.19 1903.14 21 Punjab 9550.83 9724.34 10011.10 10351.41 22 Rajasthan 13511.88 13945.92 14573.05 16934.31 23 Sikkim 45.22 42.24 45.99 49.99 24 Tamil Nadu 6967.88 7004.73 7049.19 7132.47 25 Telangana 26 Tripura 27 _ _ _ 4207.26 110.60 118.04 129.70 141.23 Uttar Pradesh 22556.48 23329.55 24193.90 25198.36 28 Uttarakhand 1416.99 1478.38 1550.15 1565.35 29 West Bengal 4671.54 4859.23 4906.21 4961.00 30 A&N Islands 26.07 21.45 14.21 15.56 31 Chandigarh 45.21 44.03 44.43 44.00 32 D.& N. Haveli 11.07 11.00 10.99 8.52 33 Daman & Diu 34 Delhi 35 Lakshadweep 36 Puducherry All India 1.00 1.00 0.82 0.82 501.98 286.58 284.31 280.06 2.38 2.21 6.07 4.19 45.00 47.17 47.25 47.64 127904.02 132430.60 137685.89 146313.55 Source : State/UT Animal Husbandry Departments Annexure-II Per Capita Availability Of Milk During 2011-12 To 2013-14 (gram/day) Sl. No. 2011-12 2012-13 2013-14 391 409 413 2 Andhra Pradesh Arunachal Pradesh 44 49 93 3 Assam 70 69 69 4 Bihar 175 188 195 5 Chhattisgarh 120 127 130 6 Goa 113 92 98 7 Gujarat 445 476 506 8 Haryana 720 767 800 9 Himachal Pradesh 447 460 461 10 Jammu & Kashmir 352 316 302 11 Jharkhand 145 146 146 12 Karnataka 244 262 272 13 Kerala 223 216 203 14 Madhya Pradesh 308 327 349 15 Maharashtra 206 213 219 16 Manipur 80 80 80 17 Meghalaya 74 83 84 18 Mizoram 35 36 40 19 Nagaland 108 94 95 20 Odisha 112 114 122 21 Punjab 945 961 980 22 Rajasthan 539 555 572 23 Sikkim 202 186 200 24 Tamil Nadu 265 541 280 25 Tripura 83 88 95 26 Uttar Pradesh 310 312 318 27 Uttarakhand 384 403 418 28 West Bengal 140 145 145 29 A&N Islands 187 131 84 30 31 32 33 34 Chandigarh Dadra & N. Haveli Daman & Diu Delhi Lakshadweep 117 89 11 82 85 103 101 13 41 82 101 98 10 39 219 35 Puducherry 99 113 111 290 299 307 1 States/UTs All India Note: Per capita availability is calculated based on State estimates of production and projected population as on 1st March, based on Census of India 2001 of RGI Annexure-III Quantity (in MTs) of Milk and Milk Products imported into Country COUNTRY AUSTRALIA FOOD ITEM Yoghurt OTHERS (CROLD MLK,CRM,KIHIR ETC) CHEESE(INCL WHEY CHEESE) NT FRMNTD & CURD GRATED OR POWDERED CHEESE OF ALL KINDS PROCESSED CHEESE NOT GRATED/POWD ERED 20122013 2013-2014 2014-2015 2015-2016 0.135 Grand Total 0.135 3.1 3.1 0.01 0.01 0.32 0.32 3.088 7.65218 3.87072 14.6109 AUSTRIA PROCESSED CHEESE NOT GRATED/POWD ERED 9.759 9.759 BELGIUM BUTTER PROCESSED CHEESE NOT GRATED/POWD ERED OTHER CHEESE 9.4829 GRATED OR POWDERED CHEESE OF ALL KINDS 0.62935 3.22 1.46 4.68 9.0005 1 8.0805 1 26.5639 BOTSWANA 0.62935 CANADA Yoghurt OTHER WHEY 0.15 200 183.793 0.15 383.793 46.035 38.556 84.591 126.8877 337.4208 57.582 148.0896 185.2717 830.7794 DENMARK MILK FOOD FOR BABIES OTHERSN(E.G.MI LK CREAM) OTHERS WHEY,CONCNTR D EVPTD CONDSD (LQD/SEMI LQD) OTHER WHEY PRODUCTS OTHERTHAN 0.802 345.26898 56.1262 36 56.1262 36 18 18 Quantity (in MTs) of Milk and Milk Products imported into Country COUNTRY FOOD ITEM WHEY CONSISTING OF NATURAL MILK CONSTITUENTS BUTTER CHEESE(INCL WHEY CHEESE) NT FRMNTD & CURD GRATED OR POWDERED CHEESE OF ALL KINDS PROCESSED CHEESE NOT GRATED/POWD ERED BLUE VEINED CHEESE OTHER CHEESE 20122013 2013-2014 2014-2015 2015-2016 1.632 8.31813 9.95013 3.347 2.887 6.234 9.8127 43.1678 1.327 21.97052 23.29752 7.407 2.08864 35.7043 2.08864 43.1113 302 302 7.992 7.992 2.5 Grand Total 55.4805 EGYPT A RP SKIMMED MILK PROCESSED CHEESE NOT GRATED/POWD ERED FRANCE 4015000 HS Code SKIMMED MILK OTHERS WHOLE MILK Yoghurt WHEY, CONCNTRD EVPTD CONDSD (LQD/SEMI LQD) WHEY,DRY,BLOC KS & POWDERED OTHER WHEY PRODUCTS OTHERTHAN WHEY CONSISTING OF NATURAL MILK CONSTITUENTS BUTTER PROCESSED CHEESE NOT GRATED/POWD ERED 19.70105 0.25 112.7086 49.58974 181.9994 0.25 5.232 12.5789 21.054 24 24 5.232 7.4208 7.14 5.1581 13.914 2165.568 167.95 4.15 72 2169.718 239.95 48.002 31.266 25 54.174 25 133.442 2.8565 23.6125 0.902 27.37105 Quantity (in MTs) of Milk and Milk Products imported into Country COUNTRY FOOD ITEM OTHER CHEESE 20122013 2013-2014 38.7828 2014-2015 149.4101 0.075 9.11 5.225 2015-2016 33.01305 Grand Total 221.20597 GERMANY 4014000 HS Code Yoghurt WHEY,CONCNTR D EVPTD CONDSD (LQD/SEMI LQD) WHEY, DRY, BLOCKS & POWDERED OTHER WHEY CHEESE (INCL WHEY CHEESE) NT FRMNTD & CURD GRATED OR POWDERED CHEESE OF ALL KINDS PROCESSED CHEESE NOT GRATED/POWD ERED OTHER CHEESE 14.24 2.496 9.42 23.66 50.01241 5.3 15.252 50.01241 20.552 3.456 4.02 9.972 2.4 42.532 0.075 14.335 43.694 8.722 162.2874 8.8 11.2 48.399 8.722 296.9124 GREECE Yoghurt PROCESSED CHEESE NOT GRATED/POWD ERED OTHER CHEESE 0.073 70.267 0.2614 20.287 0.5664 0.073 6.392 0.36 96.946 1.1878 4.008 4.008 2.1705 7.5 3.4545 28.8712 6 12.4 27.11118 81.7474 124.1325 347.6918 ITALY 4015000 HS Code Yoghurt OTHER WHEY CHEESE(INCL WHEY CHEESE) NT FRMNTD & CURD GRATED OR POWDERED CHEESE OF ALL KINDS PROCESSED CHEESE NOT GRATED/POWD ERED OTHER CHEESE 2.1705 7.5 5.8849 19.5317 6.4 11.059 94.9079 85.96232 171.0365 JAPAN SKIMMED MILK 30 30 Quantity (in MTs) of Milk and Milk Products imported into Country COUNTRY NETHERLA NDANTIL FOOD ITEM 20122013 PRODUCTS OTHERTHAN WHEY CONSISTING OF NATURAL MILK CONSTITUENTS OTHER CHEESE 2013-2014 2014-2015 2015-2016 Grand Total 11.102 10.327 8.664 2.0068 19.766 12.333 7.344 7.344 NETHERLA NDS 4015000 HS Code WHEY,CONCNTR D EVPTD CONDSD (LQD/SEMI LQD) PRODUCTS OTHERTHAN WHEY CONSISTING OF NATURAL MILK CONSTITUENTS BUTTER OIL CHEESE (INCL WHEY CHEESE) NT FRMNTD & CURD PROCESSED CHEESE NOT GRATED/ POWDERED OTHER CHEESE 20.32 20.32 16.539 28.598 0.072 45.137 0.072 0.3380 1.6961 2.03424 14.9667 11.4963 32.2775 29.1098 7.9124 55.15669 40.60623 0.3 0.7876 16 146.65 859.095 284.26 NEW ZEALAND Yoghurt BUTTER MILK WHEY, CONCNTRD EVPTD CONDSD (LQD/SEMI LQD) OTHER WHEY PRODUCTS OTHERTHAN WHEY CONSISTING OF NATURAL MILK CONSTITUENTS BUTTER BUTTER OIL OTHERS CHEESE(INCL WHEY CHEESE) 0.4876 16 113.46 161.28 67.2 84 214.05 122.98 84 384.935 7.28 13.04796 33.6 7.28 13.04796 184.8 84 25.2 25.2 Quantity (in MTs) of Milk and Milk Products imported into Country COUNTRY FOOD ITEM NT FRMNTD & CURD 20122013 2013-2014 2014-2015 2015-2016 Grand Total POLAND WHEY,DRY, BLOCKS & POWDERED PROCESSED CHEESE NOT GRATED/POWD ERED 3.431 89.408 89.408 8.3568 11.7878 0.376 0.376 REPUBLIC OF IRELAND Yoghurt PROCESSED CHEESE NOT GRATED/POWD ERED 25.0057 21.5746 46.5803 SAUDI ARAB SKIMMED MILK 50 50 MELTED BUTTER (GHEE) 0.626 0.626 9.45 9.45 SINGAPOR E SPAIN Yoghurt CHEESE(INCL WHEY CHEESE) NT FRMNTD & CURD PROCESSED CHEESE NOT GRATED/POWD ERED BLUE VEINED CHEESE OTHER CHEESE 0.404 0.2 0.096 16.2805 0.604 10.6478 27.0243 0.1728 0.054 0.1728 0.002 0.002 0.054 SWITZERL AND OTHERS(CROLD MLK,CRM,KIHIR ETC) CHEESE(INCL WHEY CHEESE) NT FRMNTD & CURD PROCESSED CHEESE NOT GRATED/POWD ERED OTHER CHEESE TAIWAN 2.904 2.904 3.0577 0.8840 0.8064 3.9417 0.8064 Quantity (in MTs) of Milk and Milk Products imported into Country COUNTRY FOOD ITEM GRATED OR POWDERED CHEESE OF ALL KINDS 20122013 2013-2014 2014-2015 2015-2016 Grand Total 0.285 0.285 96 72 168 342.1 3251.2 195.55 912.8 TURKEY WHEY, CONCNTRD EVPTD CONDSD (LQD/SEMI LQD) WHEY,DRY,BLOC KS & POWDERED OTHER WHEY PRODUCTS OTHERTHAN WHEY CONSISTING OF NATURAL MILK CONSTITUENTS 156.558 400 537.65 4320.558 400 USA OTHERS Yoghurt WHEY,CONCNTR D EVPTD CONDSD (LQD/SEMI LQD) WHEY,DRY,BLOC KS & POWDERED OTHER CHEESE 60 0.24 0.327 0.2364 0.24 0.5634 80 5.08308 145.08308 3.0508 26.0764 3.05088 26.0764 124.8 1023.849 UGANDA MELTED BUTTER (GHEE) 899.049 UNITED KINGDOM OTHERS WHEY,DRY,BLOC KS & POWDERED BUTTER CHEESE(INCL WHEY CHEESE) NT FRMNTD & CURD PROCESSED CHEESE NOT GRATED/POWD ERED OTHER CHEESE Grand Total 0.0881 246 290.725 0.09 810.396 0.0881 397.909 1.202 791.5288 12.05 55.42692 8294.12711 1745.03 0.09 1.202 31.52201 85.15587 5906.44327 11.78508 24.3809 1778.86234 55.35709 164.96376 16770.9615 Annexure-IV Annual Public Laboratory Testing Report of Milk for the year 2014-2015 Sr. No. 1. 2. 3. 4. 5. 6. 7. 8. 9. 10. 11. 12. 13. 14. 15. 16. 17. 18. 19. 20. 21. 22. 23. 24. 25. 26. 27. 28. 29. 30. 31. 32. 33. 34. 35. 36. Name of the State/ U.T. A & N Islands Andhra Pradesh Arunachal Pradesh Assam (AprilJune) Bihar Chandigarh Chhattisgarh Dadra & N.H Daman & Diu Delhi Goa Gujarat Haryana Himachal Pradesh Jammu & Kashmir (till Dec’14) Jharkhand Karnataka Kerala Lakshadweep Madhya Pradesh Maharashtra Manipur Meghalaya Mizoram Nagaland Odisha Puducherry Punjab Rajasthan Sikkim Tamil Nadu Telangana Tripura Uttar Pradesh Uttarakhand West Bengal Total: Total No. of samples taken No. of Samples Analysed No. of Samples found adulterated and Misbranded Nil Nil Nil Nil Nil 271 271 25 6 4 Rs. 1, 77, 000 27 21 4 4 2 17 17 4 1 33 13 95 12 13 95 2 37 2 34 28 42 37 39 3 1 Rs. 1000 165 173 54 57 42 Rs. 2, 33, 100 22 287 100 17 279 96 1 40 4 1 1 983 948 282 21 170 58 58 2024 1620 421 22 103 33 Rs. 10, 34, 000 1 1 1 72 50 1 72 50 15 165 158 36 1 28 26 Rs. 4, 72, 500 207 160 45 4609 4069 1009 51 373 160 60/ Rs. 19, 17, 600 Source:-State/UT Governments No. of Cases Launched Criminal No. of Convictions/ Penalties Civil Convictions Penalties/ Amount raised in Rupees Nil Nil
