Section1.2
advertisement
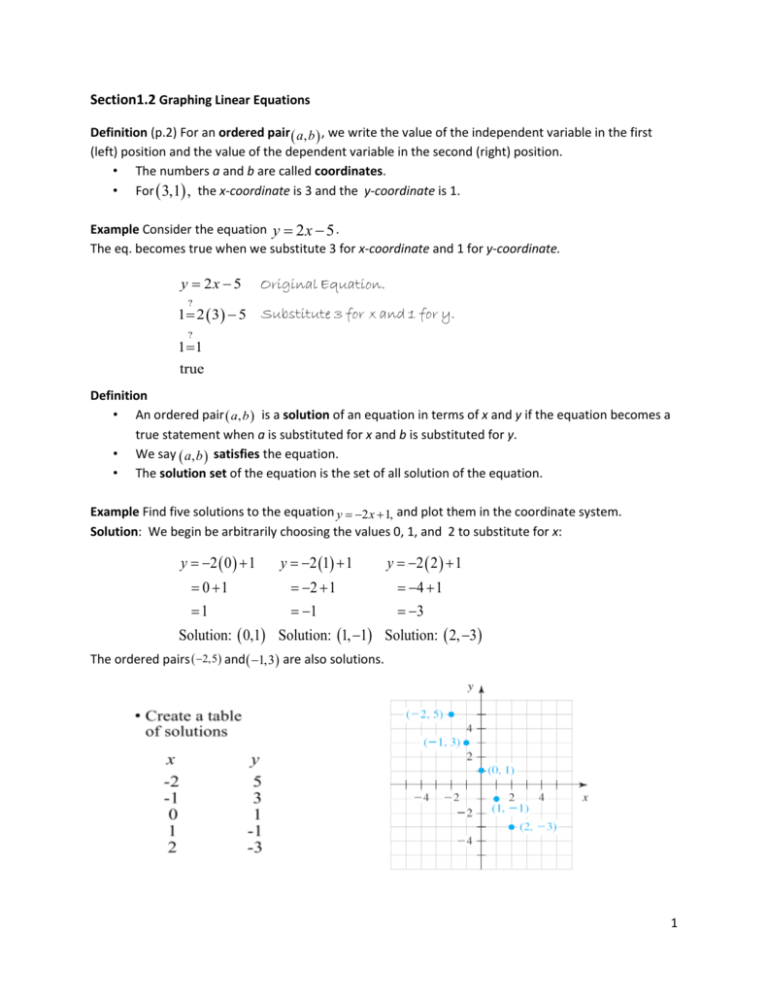
Section1.2 Graphing Linear Equations Definition (p.2) For an ordered pair a, b , we write the value of the independent variable in the first (left) position and the value of the dependent variable in the second (right) position. • The numbers a and b are called coordinates. • For 3,1 , the x-coordinate is 3 and the y-coordinate is 1. Example Consider the equation y 2 x 5 . The eq. becomes true when we substitute 3 for x-coordinate and 1 for y-coordinate. y 2x 5 ? 1 2 3 5 Original Equation. Substitute 3 for x and 1 for y. ? 1 1 true Definition • An ordered pair a, b is a solution of an equation in terms of x and y if the equation becomes a true statement when a is substituted for x and b is substituted for y. • We say a, b satisfies the equation. • The solution set of the equation is the set of all solution of the equation. Example Find five solutions to the equation y 2 x 1, and plot them in the coordinate system. Solution: We begin be arbitrarily choosing the values 0, 1, and 2 to substitute for x: y 2 0 1 0 1 1 y 2 1 1 y 2 2 1 2 1 1 4 1 3 Solution: 0,1 Solution: 1, 1 Solution: 2, 3 The ordered pairs 2,5 and 1,3 are also solutions. 1 Note There are infinitely many solutions. To describe all solutions, need graphs. Connect all 5 points then every point on the line represents a solution. Call the line the graph of the eq. y 2 x 1 The point 3, 5 lies on the line => should satisfy the equation. Check! 2, 4 is not on the line => should not satisfy the equation. Check! Definition The graph of an equation in two variables is the set of points that correspond to all solutions of the equation. Notice The equation y .2 x 1 is of the form y mx b . i.e. m = -2 and b =1 Equation of the form : y mx b If an equation can be put into the form y mx b where m and b are constants, then the graph of the equation is a line. Example What is m and b for the equations 3 y x 2, 2 y 3x and y 3? Example Sketch the graph of the equation 30 x 6 y 5 0. Solution: First we solve for y 30 x 6 y 12 0 30 x 6 y 12 Original Equation. Subtract 12 from both sides. 6 y 30 x 12 Subtract 30x from both sides. 6 30 12 y x 6 6 6 y 5 x 2 y=-5x -2 is of the form y mx b => The graph of the equation is a line Find a few solution points of the line (use table), plot the points and draw the line. 0 2 0 3 3 1 2 1 3 1 2 2 2 3 1 2 Example Sketch the graph of 3 2 y 5 2 x 3 8 x. Solution: Use the distributive property on the left-hand side. Collect like terms Isolate y 3 2 y 5 2 x 3 8x Original equation Distributive property 6 y 15 6 x 3 6 y 15 15 6 x 3 15 Add 15 to both sides. 6 6 12 y x 6 6 6 y x 2 0 0 2 2 1 1 2 1 2 2 2 0 1 Example Sketch a graph of y 2 x 1. Solution: Avoid fraction values for y Sometimes we find intercepts to graph a line. • x-intercept is on the y-axis, so y = 0 • y-intercepts in on the x-axis, so x = 0 Direction: • For an equation containing the variables x and y • x-intercept: Substitute y = 0 and solve for x • y-intercept: Substitute x = 0 and solve for y Example Use intercepts to sketch a graph of y 2 x 4. Solution: y-intercept: Set x = 0 y 2 0 4 Set x = 0. Simplify. y4 3 x-intercept: Set y = 0 0 2 x 4 4 2 x 4 2 x 2 2 2x Example Graph the equation of x 3. Example Graph the equation of y 5. Property If a and b are constants: • An equation that can be put into the form x=a has a vertical line as its graph • An equation that can be put into the form y=b has a horizontal line as its graph Property In an equation can be put into either form y mx b or xa where m, a, and b are constants, then the graph of the equation is a line. We call such an equation a linear equation in two variables 4

