Chapter 5 – 6 Project
advertisement
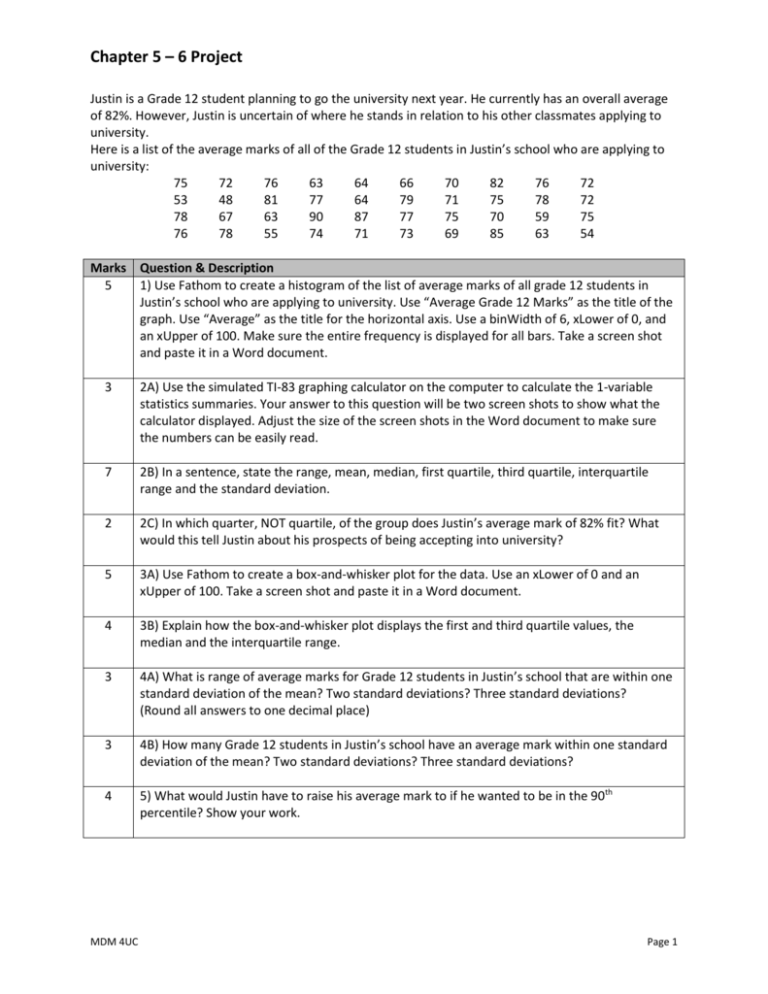
Chapter 5 – 6 Project Justin is a Grade 12 student planning to go the university next year. He currently has an overall average of 82%. However, Justin is uncertain of where he stands in relation to his other classmates applying to university. Here is a list of the average marks of all of the Grade 12 students in Justin’s school who are applying to university: 75 72 76 63 64 66 70 82 76 72 53 48 81 77 64 79 71 75 78 72 78 67 63 90 87 77 75 70 59 75 76 78 55 74 71 73 69 85 63 54 Marks Question & Description 5 1) Use Fathom to create a histogram of the list of average marks of all grade 12 students in Justin’s school who are applying to university. Use “Average Grade 12 Marks” as the title of the graph. Use “Average” as the title for the horizontal axis. Use a binWidth of 6, xLower of 0, and an xUpper of 100. Make sure the entire frequency is displayed for all bars. Take a screen shot and paste it in a Word document. 3 2A) Use the simulated TI-83 graphing calculator on the computer to calculate the 1-variable statistics summaries. Your answer to this question will be two screen shots to show what the calculator displayed. Adjust the size of the screen shots in the Word document to make sure the numbers can be easily read. 7 2B) In a sentence, state the range, mean, median, first quartile, third quartile, interquartile range and the standard deviation. 2 2C) In which quarter, NOT quartile, of the group does Justin’s average mark of 82% fit? What would this tell Justin about his prospects of being accepting into university? 5 3A) Use Fathom to create a box-and-whisker plot for the data. Use an xLower of 0 and an xUpper of 100. Take a screen shot and paste it in a Word document. 4 3B) Explain how the box-and-whisker plot displays the first and third quartile values, the median and the interquartile range. 3 4A) What is range of average marks for Grade 12 students in Justin’s school that are within one standard deviation of the mean? Two standard deviations? Three standard deviations? (Round all answers to one decimal place) 3 4B) How many Grade 12 students in Justin’s school have an average mark within one standard deviation of the mean? Two standard deviations? Three standard deviations? 4 5) What would Justin have to raise his average mark to if he wanted to be in the 90th percentile? Show your work. MDM 4UC Page 1 Chapter 5 – 6 Project Many universities use a numerical score called the Grade Point Average (GPA). It assigns a value between 0 and 4 for each final grade and computes a weighted average by the number of credits. Most of Justin’s courses are full-credit courses, but he did take a half-credit course in Civics. Justin’s Marks (all worth 1 credit, unless noted): English: 86 Calculus: 83 (2 credits) Geometry: 78 Data Management: 88 (1.5 credits) History: 74 Physics: 77 Civics: 92 (0.5) Mark Range 93-100 86-92 80-85 77-79 73-76 70-72 67-69 63-66 60-62 57-59 53-56 50-52 <50 Letter Grade A+ A AB+ B BC+ C CD+ D DF Numerical Value 4.0 4.0 3.7 3.3 3.0 2.7 2.3 2.0 1.7 1.3 1.0 0.7 0 Marks Question & Description 4 6A) In Word, create a table with the column headings: Course, Justin’s Mark, Numerical Value. Fill in the appropriate entries. 3 6B) Calculate Justin’s weighted GPA to one decimal place. Show your work. 1 Every sheet of your assignment should have your last name and page numbering set up in the header for every page. 1 Use full sentences, proper spelling and grammar, to answer all questions. 1 Copy your completed assignment to the Assignment Hand-In folder. 1 Submit this sheet, with your name on it, for marking purposes. 47 Total MDM 4UC Page 2


![The Irony of Love (122) [by Proud 86].](http://s3.studylib.net/store/data/007306595_1-aca9830606a408d7bdeb2a12d7258405-300x300.png)
