Grade 5 Math Long Range Plan (2013
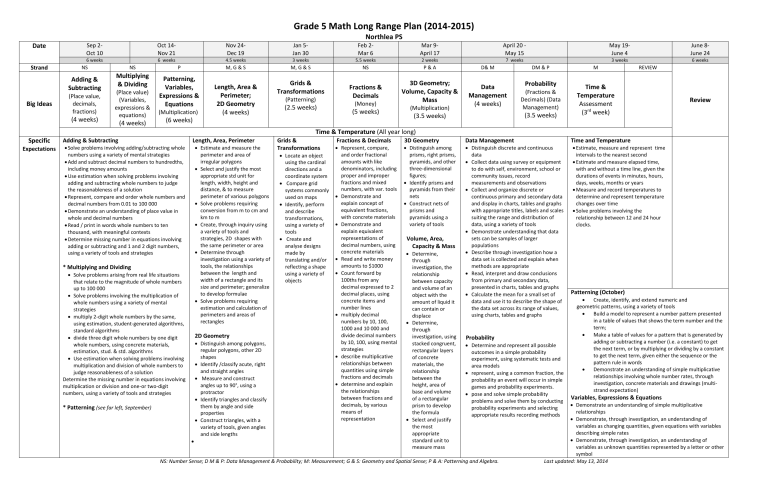
Date
Strand
Big Ideas
Specific
Expectations
Sep 2-
Oct 10
6 weeks
Oct 14-
Nov 21
6 weeks
Nov 24-
Dec 19
4.5 weeks
Grade 5 Math Long Range Plan (2014-2015)
Jan 5-
Jan 30
3 weeks
Northlea PS
Feb 2-
Mar 6
5.5 weeks
Mar 9-
April 17
2 weeks
April 20 -
May 15
7 weeks
May 19-
June 4
3 weeks
June 8-
June 24
6 weeks
NS
Adding &
Subtracting
(Place value, decimals, fractions)
(4 weeks)
NS
Multiplying
& Dividing
(Place value)
(Variables, expressions & equations)
(4 weeks)
P
Patterning,
Variables,
Expressions &
Equations
(Multiplication)
(6 weeks)
M, G & S
Length, Area &
Perimeter;
2D Geometry
(4 weeks)
M, G & S
Grids &
Transformations
(Patterning)
(2.5 weeks)
NS
Fractions &
Decimals
(Money)
(5 weeks)
P & A
3D Geometry;
Volume, Capacity &
Mass
(Multiplication)
(3.5 weeks)
D& M
Data
Management
(4 weeks)
DM & P
Probability
(Fractions &
Decimals) (Data
Management)
(3.5 weeks)
(3 rd
M
Time &
Temperature
Assessment
week)
REVIEW
Review
Time & Temperature (All year long)
Adding & Subtracting
Solve problems involving adding/subtracting whole
Use estimation when solving problems involving
Demonstrate an understanding of place value in
numbers using a variety of mental strategies
Add and subtract decimal numbers to hundredths, including money amounts adding and subtracting whole numbers to judge the reasonableness of a solution
Represent, compare and order whole numbers and decimal numbers from 0.01 to 100 000 whole and decimal numbers
Read / print in words whole numbers to ten thousand, with meaningful contexts
Determine missing number in equations involving adding or subtracting and 1 and 2 digit numbers, using a variety of tools and strategies
* Multiplying and Dividing
Solve problems arising from real life situations that relate to the magnitude of whole numbers
up to 100 000
Solve problems involving the multiplication of whole numbers using a variety of mental strategies
multiply 2-digit whole numbers by the same, using estimation, student-generated algorithms, standard algorithms
divide three digit whole numbers by one digit whole numbers, using concrete materials, estimation, stud. & std. algorithms
Use estimation when solving problems involving multiplication and division of whole numbers to judge reasonableness of a solution
Determine the missing number in equations involving multiplication or division and one-or two-digit numbers, using a variety of tools and strategies
* Patterning (see far left, September)
Length, Area, Perimeter
Estimate and measure the
Select and justify the most
appropriate std unit for length, width, height and distance, & to measure perimeter of various polygons
perimeter and area of irregular polygons
Solve problems requiring conversion from m to cm and km to m
Create, through inquiry using a variety of tools and strategies, 2D shapes with the same perimeter or area
Determine through investigation using a variety of tools, the relationships between the length and width of a rectangle and its size and perimeter; generalize to develop formulae
Solve problems requiring estimation and calculation of perimeters and areas of rectangles
2D Geometry
Distinguish among polygons, regular polygons, other 2D
shapes
Identify /classify acute, right and straight angles
Measure and construct angles up to 90°, using a
protractor
Identify triangles and classify them by angle and side properties
Construct triangles, with a variety of tools, given angles and side lengths
Grids &
Transformations
Locate an object using the cardinal directions and a coordinate system
Compare grid
systems commonly used on maps
Identify, perform and describe transformations, using a variety of tools
Create and analyse designs made by translating and/or reflecting a shape using a variety of objects
Fractions & Decimals
Represent, compare,
and order fractional amounts with like denominators, including proper and improper fractions and mixed numbers, with var. tools
Demonstrate and explain concept of equivalent fractions, with concrete materials
Demonstrate and explain equivalent representations of decimal numbers, using concrete materials
Read and write money amounts to $1000
Count forward by
100ths from any decimal expressed to 2 decimal places, using concrete items and number lines
multiply decimal numbers by 10, 100,
1000 and 10 000 and divide decimal numbers by 10, 100, using mental strategies
describe multiplicative relationships between
quantities using simple fractions and decimals determine and explain the relationships between fractions and decimals, by various means of representation
Distinguish among prisms, right prisms, pyramids, and other three-dimensional figures;
Identify prisms and
3D Geometry pyramids from their nets
Construct nets of prisms and pyramids using a variety of tools
Volume, Area,
Capacity & Mass
Determine,
through investigation, the relationship between capacity and volume of an object with the amount of liquid it can contain or displace
Determine, through investigation, using stacked congruent, rectangular layers of concrete materials, the relationship between the height, area of base and volume of a rectangular prism to develop the formula
Select and justify the most appropriate standard unit to measure mass
Data Management
Distinguish discrete and continuous
data
Collect data using survey or equipment to do with self, environment, school or community issues, record measurements and observations
Collect and organize discrete or continuous primary and secondary data and display in charts, tables and graphs with appropriate titles, labels and scales suiting the range and distribution of data, using a variety of tools
Demonstrate understanding that data sets can be samples of larger populations
Describe through investigation how a data set is collected and explain when methods are appropriate
Read, interpret and draw conclusions from primary and secondary data, presented in charts, tables and graphs
Calculate the mean for a small set of data and use it to describe the shape of the data set across its range of values, using charts, tables and graphs
Probability
Determine and represent all possible outcomes in a simple probability experiment, using systematic tests and area models
represent, using a common fraction, the probability an event will occur in simple games and probability experiments.
pose and solve simple probability problems and solve them by conducting probability experiments and selecting appropriate results recording methods
NS: Number Sense; D M & P: Data Management & Probability; M: Measurement; G & S: Geometry and Spatial Sense; P & A: Patterning and Algebra.
Time and Temperature
Estimate, measure and represent time
intervals to the nearest second
Estimate and measure elapsed time, with and without a time line, given the durations of events in minutes, hours, days, weeks, months or years
Measure and record temperatures to determine and represent temperature changes over time
Solve problems involving the relationship between 12 and 24 hour clocks.
Patterning (October)
Create, identify, and extend numeric and
geometric patterns, using a variety of tools
Build a model to represent a number pattern presented in a table of values that shows the term number and the term;
Make a table of values for a pattern that is generated by adding or subtracting a number (i.e. a constant) to get the next term, or by multiplying or dividing by a constant to get the next term, given either the sequence or the pattern rule in words
Demonstrate an understanding of simple multiplicative relationships involving whole number rates, through investigation, concrete materials and drawings (multistrand expectation)
Variables, Expressions & Equations
Demonstrate an understanding of simple multiplicative
relationships
Demonstrate, through investigation, an understanding of variables as changing quantities, given equations with variables describing simple rates
Demonstrate, through investigation, an understanding of variables as unknown quantities represented by a letter or other symbol
Last updated: May 13, 2014
