gcb13022-sup-0001-TableS1-S2
advertisement
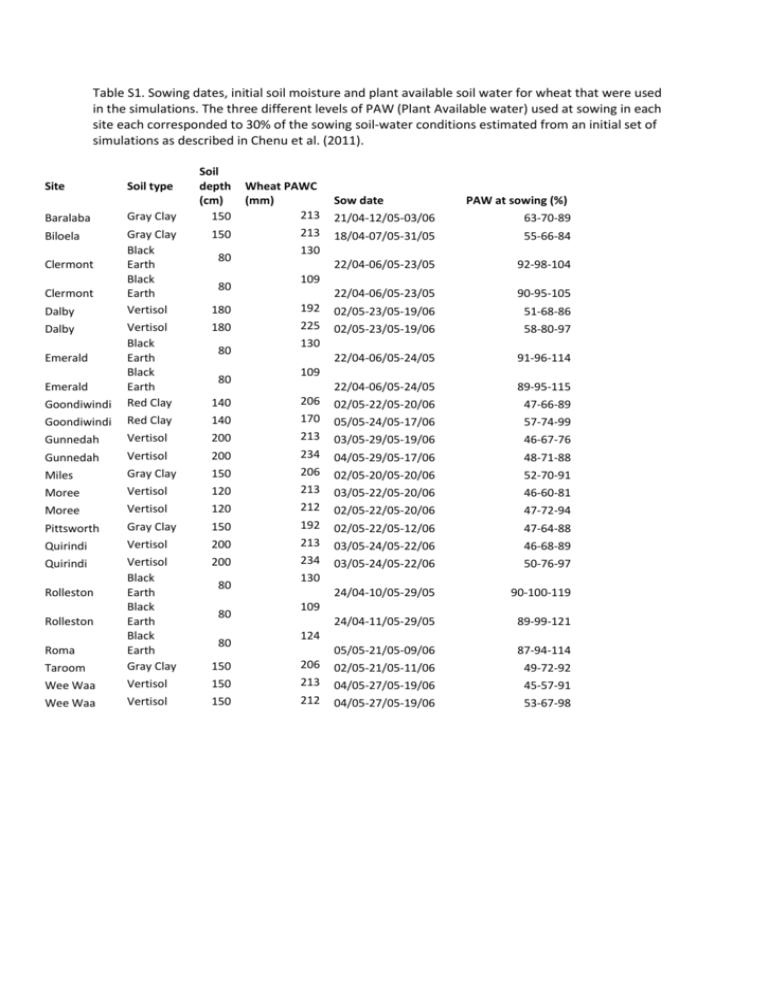
Table S1. Sowing dates, initial soil moisture and plant available soil water for wheat that were used in the simulations. The three different levels of PAW (Plant Available water) used at sowing in each site each corresponded to 30% of the sowing soil-water conditions estimated from an initial set of simulations as described in Chenu et al. (2011). Site Soil type Baralaba Gray Clay Biloela Gray Clay Black Earth Black Earth Vertisol Clermont Clermont Soil depth (cm) 150 Wheat PAWC (mm) 213 150 213 80 80 Sow date PAW at sowing (%) 21/04-12/05-03/06 63-70-89 18/04-07/05-31/05 55-66-84 22/04-06/05-23/05 92-98-104 22/04-06/05-23/05 90-95-105 130 109 180 192 02/05-23/05-19/06 51-68-86 180 02/05-23/05-19/06 58-80-97 22/04-06/05-24/05 91-96-114 Goondiwindi Vertisol Black Earth Black Earth Red Clay 225 Goondiwindi Red Clay Gunnedah Vertisol Dalby Dalby Emerald Emerald Gunnedah Vertisol 80 80 130 109 22/04-06/05-24/05 89-95-115 140 206 02/05-22/05-20/06 47-66-89 140 170 05/05-24/05-17/06 57-74-99 200 213 03/05-29/05-19/06 46-67-76 200 234 04/05-29/05-17/06 48-71-88 Miles Gray Clay 150 206 02/05-20/05-20/06 52-70-91 Moree Vertisol 120 213 03/05-22/05-20/06 46-60-81 Moree Vertisol 120 212 02/05-22/05-20/06 47-72-94 150 192 02/05-22/05-12/06 47-64-88 03/05-24/05-22/06 46-68-89 03/05-24/05-22/06 50-76-97 24/04-10/05-29/05 90-100-119 24/04-11/05-29/05 89-99-121 Pittsworth Gray Clay Quirindi Vertisol 200 213 Quirindi 200 234 05/05-21/05-09/06 87-94-114 Taroom Vertisol Black Earth Black Earth Black Earth Gray Clay 150 206 02/05-21/05-11/06 49-72-92 Wee Waa Vertisol 150 213 04/05-27/05-19/06 45-57-91 Wee Waa Vertisol 150 212 04/05-27/05-19/06 53-67-98 Rolleston Rolleston Roma 80 80 80 130 109 124 Table S2: Description of sites, soils, and management systems used for sorghum and wheat simulations, along with the weightings given to each in determining aggregate statistics at site or regional scale. Each site had a unique weather station, and one or two different soil types. For sorghum, up to six different management systems were considered. (For wheat, all simulations assumed a sowing density of 100 000 plants ha-1, see Table S1). For all site-soil-management system combinations, simulations were performed for three different sowing dates and three initial sowing moisture values, and the output of each was weighted equally in computing aggregate statistics. Site Name Central Queensland Clermont Emerald Soil (description - depth (cm) - water holding capacity (%)) Sorghu m area (%) Wheat area (%) Black Earth – 80 –15 4.7 1.2 Sorghum management system percentage with each site-soil (row configuration (solid, single skip row, double skip (DS) row), sowing density (kplants ha-1)) Solid, Solid, Skip, Skip, DS, DS, 35 50 35 50 35 50 40 0 60 0 0 0 Black Earth – 120 – 15 2.0 0.5 40 0 60 0 0 0 Black Earth – 80 – 15 5.0 1.3 20 0 80 0 0 0 Black Earth – 120 – 15 1.7 0.4 30 0 70 0 0 0 Baralaba Grey Clay – 150 – 20 6.7 1.7 0 70 0 30 0 0 Biloela Grey Clay – 150 – 20 6.7 1.7 0 70 0 30 0 0 Rolleston Black Earth – 80 – 15 1.7 0.4 30 0 70 0 0 0 Black Earth – 120 – 15 5.0 1.3 30 0 70 0 0 0 Southern Queensland Taroom Grey Clay – 120 – 20 6.7 4.6 0 60 0 20 0 20 Roma Black Earth – 80 – 20 6.7 4.6 30 0 70 0 0 0 Miles Grey Clay – 120 – 20 6.7 7.6 0 60 0 20 0 20 Dalby Grey Clay – 150 – 18 2.7 1.9 0 70 0 30 0 0 Vertosol – 180 – 22 4.0 2.7 0 100 0 0 0 0 Pittsworth Grey Clay – 150 – 18 6.7 4.6 0 80 0 20 0 0 Goondiwindi Grey Clay – 120 – 20 4.7 5.3 0 50 0 50 0 0 Red Chromosol – 140 – 15 2.0 2.3 0 30 0 35 0 35 Grey Clay – 150 – 20 5.7 18.1 0 40 0 40 0 20 Black Earth – 150 – 20 1.0 3.2 0 90 0 10 0 0 Grey Clay – 150 – 20 5.7 18.1 0 60 0 30 0 10 Black Earth – 150 – 20 1.0 3.2 0 100 0 0 0 0 Grey Clay – 150 – 20 4.0 4.7 0 100 0 0 0 0 Black Earth – 200 – 20 2.7 3.1 0 100 0 0 0 0 Grey Clay – 150 – 20 1.0 1.2 0 100 0 0 0 0 Black Earth – 200 – 20 5.7 6.6 0 100 0 0 0 0 Northern New South Wales Moree Wee Waa Gunnedah Quirindi


![[1.1] Prehistoric Origins Work Sheet](http://s3.studylib.net/store/data/006616577_1-747248a348beda0bf6c418ebdaed3459-300x300.png)
