Freshwater Ecosystem in a Jar – “ECOJAR”
advertisement

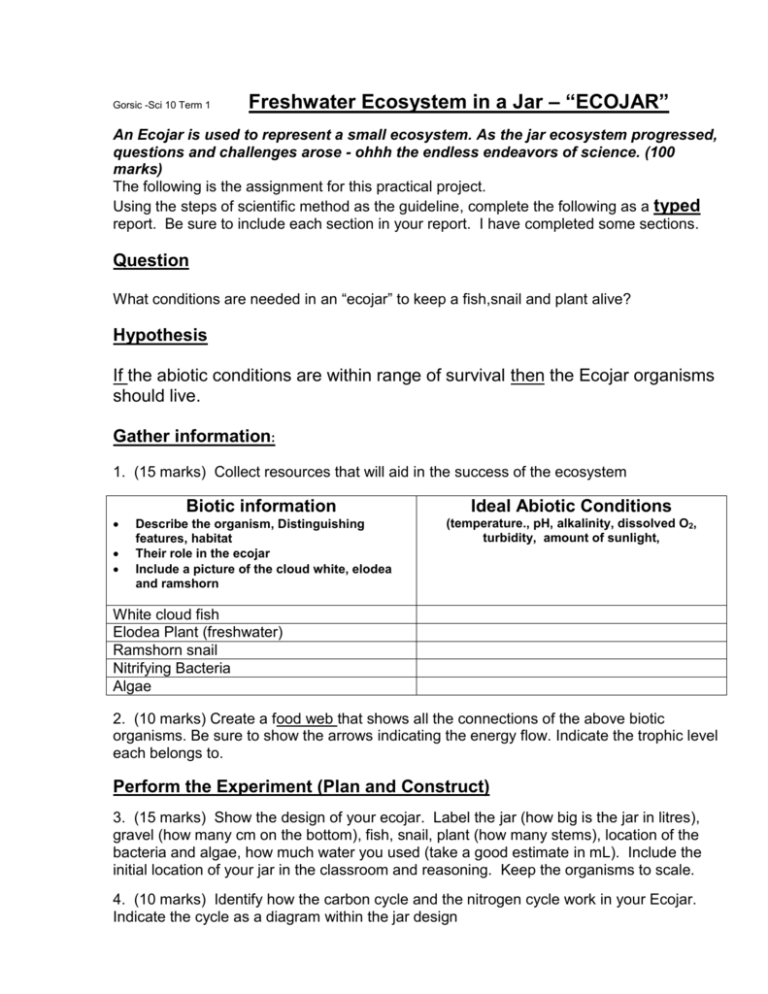
Gorsic -Sci 10 Term 1 Freshwater Ecosystem in a Jar – “ECOJAR” An Ecojar is used to represent a small ecosystem. As the jar ecosystem progressed, questions and challenges arose - ohhh the endless endeavors of science. (100 marks) The following is the assignment for this practical project. Using the steps of scientific method as the guideline, complete the following as a typed report. Be sure to include each section in your report. I have completed some sections. Question What conditions are needed in an “ecojar” to keep a fish,snail and plant alive? Hypothesis If the abiotic conditions are within range of survival then the Ecojar organisms should live. Gather information: 1. (15 marks) Collect resources that will aid in the success of the ecosystem Biotic information Ideal Abiotic Conditions Describe the organism, Distinguishing features, habitat Their role in the ecojar Include a picture of the cloud white, elodea and ramshorn (temperature., pH, alkalinity, dissolved O2, turbidity, amount of sunlight, White cloud fish Elodea Plant (freshwater) Ramshorn snail Nitrifying Bacteria Algae 2. (10 marks) Create a food web that shows all the connections of the above biotic organisms. Be sure to show the arrows indicating the energy flow. Indicate the trophic level each belongs to. Perform the Experiment (Plan and Construct) 3. (15 marks) Show the design of your ecojar. Label the jar (how big is the jar in litres), gravel (how many cm on the bottom), fish, snail, plant (how many stems), location of the bacteria and algae, how much water you used (take a good estimate in mL). Include the initial location of your jar in the classroom and reasoning. Keep the organisms to scale. 4. (10 marks) Identify how the carbon cycle and the nitrogen cycle work in your Ecojar. Indicate the cycle as a diagram within the jar design Observations and Revisions made Observations: quantitative observations and descriptions of the environement or how the organisms the effect on the organisms Revisions: What changes did you do on that date (i.e. fed the fish, moved the jar, took the lid off, changed the water, place an aerator in the jar 5. Complete the table (10 marks) Quanitative Observations Date Dissolved pH O2 (mg/L) Qualitative Observations Temp. (oC) Animal Your Behaviour actions 6. (10 marks) Make a line graph showing the variables - O2, temperature and pH X axis will show the dates and the y-axis indicates the three variables Analyse the Data 7. (10 marks) i) Describe any trends either to the biotic or abiotic factors. ii) Identify any changes in the abiotic or biotic factors when revisions were made. Discussion 8. (10 marks) Identify possible factors that contributed to the results you ended up with and describe the impact. Conclusion 9. (2 marks) Did your results support or not support the hypothesis? Explain 10. (2 Marks) If you were to do the project again, what would you do differently? 11. (4 marks) What did you enjoy about the project, what did you find frustrating? Explainbe honest. 12. (2 marks) Do you recommend this project be done in future classes? What other activity would you have liked to have done? Resources You must give credit to where you obtained (stole) your information from. Identify the Name of the site, the URL and the date (if possible). Show me you’ve looked further than Wikepedia – the untrusted site.


