Interpreting Graphs Notes-Answers
advertisement

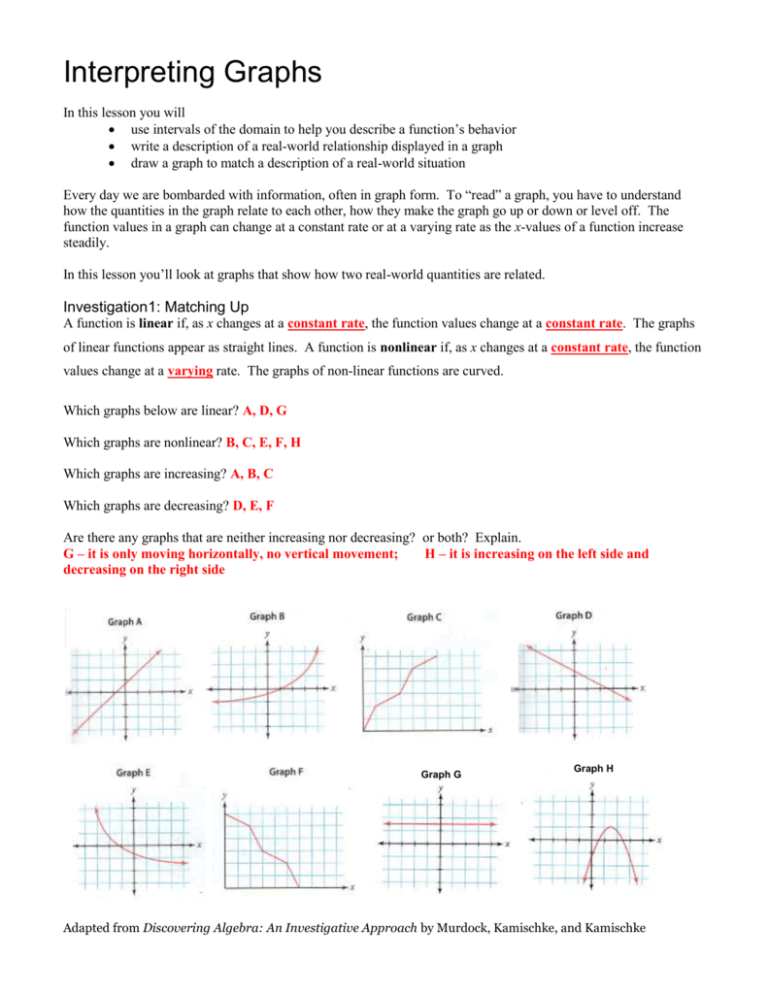
Interpreting Graphs In this lesson you will use intervals of the domain to help you describe a function’s behavior write a description of a real-world relationship displayed in a graph draw a graph to match a description of a real-world situation Every day we are bombarded with information, often in graph form. To “read” a graph, you have to understand how the quantities in the graph relate to each other, how they make the graph go up or down or level off. The function values in a graph can change at a constant rate or at a varying rate as the x-values of a function increase steadily. In this lesson you’ll look at graphs that show how two real-world quantities are related. Investigation1: Matching Up A function is linear if, as x changes at a constant rate, the function values change at a constant rate. The graphs of linear functions appear as straight lines. A function is nonlinear if, as x changes at a constant rate, the function values change at a varying rate. The graphs of non-linear functions are curved. Which graphs below are linear? A, D, G Which graphs are nonlinear? B, C, E, F, H Which graphs are increasing? A, B, C Which graphs are decreasing? D, E, F Are there any graphs that are neither increasing nor decreasing? or both? Explain. G – it is only moving horizontally, no vertical movement; H – it is increasing on the left side and decreasing on the right side Graph G Graph H Adapted from Discovering Algebra: An Investigative Approach by Murdock, Kamischke, and Kamischke In order to describe the relationship pictured on a graph, it often help to break the domain into intervals where the graph is increasing, decreasing, or constant. EXAMPLE 1 Use the intervals marked on the x-axis in the graph below to help you discuss where the function is increasing or decreasing and where it is linear or nonlinear. The first interval is done for you. Interval 1 Interval 2 Interval 3 Interval 4 Interval 1: 0 ≤ 𝑥 ≤ 3 The function is decreasing in the interval 0 ≤ 𝑥 ≤ 6. In the interval 0 ≤ 𝑥 ≤ 3, the interval is nonlinear and decreases slowly at first and then more quickly. Interval 2: 𝟑 ≤ 𝒙 ≤ 𝟔 The function continues to decrease, but at a constant rate. The interval is linear. Interval 3: 𝟔 ≤ 𝒙 ≤ 𝟏𝟎 The function neither increases or decreases. The interval is linear Interval 4: 𝟏𝟎 ≤ 𝒙 ≤ 𝟏𝟒 The function stays the same for a short amount of time, then increases slowly and then more quickly. The interval is nonlinear. Investigation2: Describing Graphs Consider the following scenario: A turtle crawls steadily from its pond across the lawn. Then a small dog picks up the turtle and runs with across the lawn. The dog slows down and finally drops the turtle. The turtle rests for a few minutes after this excitement. Then a young girl comes along, picks up the turtle, and slowly carries it back to the pond. Which of the graphs depicts the turtle’s distance from the pond over time? Explain. Graph B; This is the only graph that shows a time of no movement. Adapted from Discovering Algebra: An Investigative Approach by Murdock, Kamischke, and Kamischke Investigation3: Sketch a Graph Read the following story about a volleyball game. Before a volleyball game starts, the people that can be found in the school gym are the players, coaches, and the people working the event (ticket takers, officials, scorers, etc.) Slowly the fans arrive for the match. Just before the first game, the people are coming in as fast as the tickets can be sold. After the match is over, most of the parents and fans leave. Then more students arrive for the after-game dance. Most of the students leave after an hour. The people that remain are the ones who have been working at the gym all night long. What is the independent variable for this situation? Time during the day What are reasonable values for the domain? Are they positive or negative numbers? Whole numbers or decimals? Numbers zero and above Positive Could be both What is the dependent variable? People in the gym What are reasonable values for the domain? Are they positive or negative numbers? Whole numbers or decimals? Numbers zero and above Positive Whole numbers Sketch a graph that matches the story. Be sure to label the axes. (Graphs may vary depending on interpretation of “Time of day”) People in the gym Time of day Is your graph discrete or continuous? Explain why you drew it that way. Discrete, discrete represents whole number as people are Compare your graph to your partner’s graph. How are they alike? How are they different? Are both graphs reasonable? Answers will vary Adapted from Discovering Algebra: An Investigative Approach by Murdock, Kamischke, and Kamischke


