Z-Scores & Confidence Intervals
advertisement
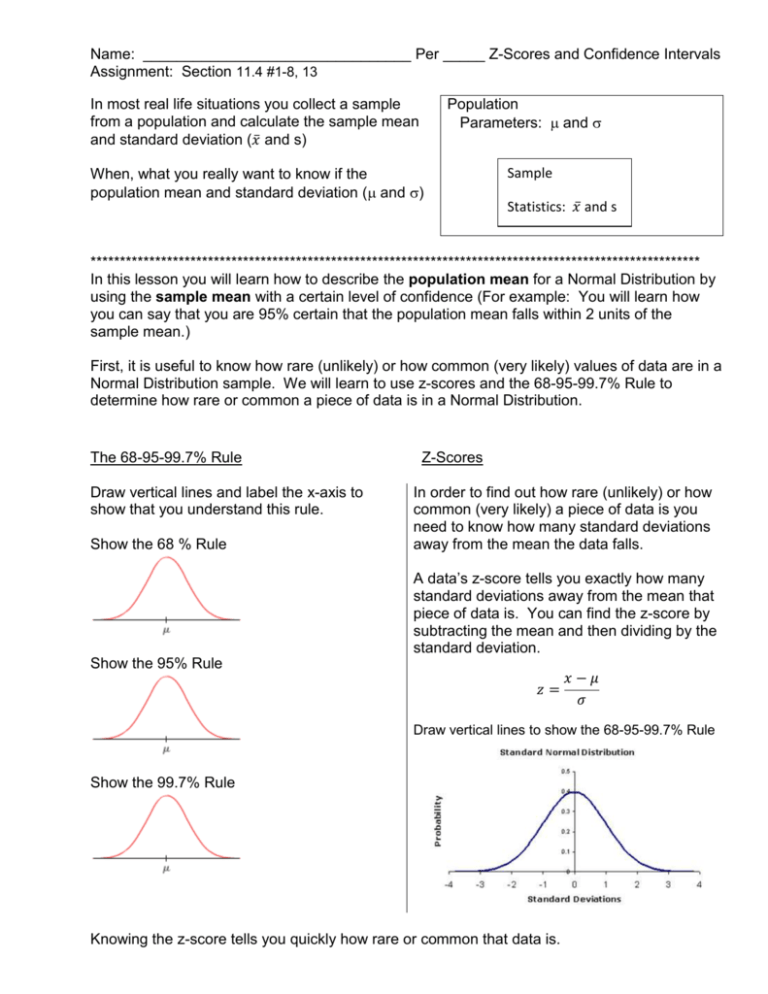
Name: ________________________________ Per _____ Z-Scores and Confidence Intervals Assignment: Section 11.4 #1-8, 13 In most real life situations you collect a sample from a population and calculate the sample mean and standard deviation (𝑥̅ and s) Population Parameters: and When, what you really want to know if the population mean and standard deviation ( and ) Sample Statistics: 𝑥̅ and s ******************************************************************************************************** In this lesson you will learn how to describe the population mean for a Normal Distribution by using the sample mean with a certain level of confidence (For example: You will learn how you can say that you are 95% certain that the population mean falls within 2 units of the sample mean.) First, it is useful to know how rare (unlikely) or how common (very likely) values of data are in a Normal Distribution sample. We will learn to use z-scores and the 68-95-99.7% Rule to determine how rare or common a piece of data is in a Normal Distribution. The 68-95-99.7% Rule Draw vertical lines and label the x-axis to show that you understand this rule. Show the 68 % Rule Z-Scores In order to find out how rare (unlikely) or how common (very likely) a piece of data is you need to know how many standard deviations away from the mean the data falls. A data’s z-score tells you exactly how many standard deviations away from the mean that piece of data is. You can find the z-score by subtracting the mean and then dividing by the standard deviation. Show the 95% Rule 𝑧= 𝑥−𝜇 𝜎 Draw vertical lines to show the 68-95-99.7% Rule Show the 99.7% Rule Knowing the z-score tells you quickly how rare or common that data is. Example A: The heights of a large group of men are distributed normally with mean 70 inches and standard deviation 2.5 inches. (a) Find the z-values for 67.5 inches and 72.5 inches (b) What is the probability that a randomly chosen member of this group has height x between 67.5 and 72.5 inches? (c) What is the probability that a randomly chosen member of this group has height x between 65 and 75 inches? (d) Find an interval of x-values, symmetric about the mean, that contains 95% of the heights (e) Find an interval of x-values, symmetric about the mean, that contains 99.7% of the heights (f) Find an interval of x-values, symmetric about the mean, that contains 80% of the heights. Strategy Hint Box: You can use your calculator and graph the Standard Normal Distribution using the equation we learned last class: 𝑦 = −𝑥 2 1 𝑒) ( √ √2𝜋 Then, you can find the values of z on either side of z=0 so that the area is 0.80. 𝑥−𝜇 Use these z-values you find on your calculator to solve for x using: 𝑧 = . 𝜎 Confidence Intervals If you wanted to know the average height of all the men in your state, you would need to measure every man’s height and find the mean. This just isn’t practical! You could collect a sample of men from the state and calculate their mean height. That number is a statistic that describes the mean height of your sample. It is unlikely that this sample mean would be equal to the population mean. However, the sample mean can provide a good estimate of the population mean IF the men in your sample were chosen randomly so that they represented all the men in your state. THINK ABOUT IT It makes sense that the more men in your sample, the better the sample mean would approximate the population men. We can measure the accuracy of the sample mean as an approximation of the population mean using the margin of error. It makes sense that the formula for the margin of error would depend on how spread out the data is and also on the size of your sample. It also depends on z because z is selected to give you the amount of confidence you need in your estimate of the population parameter. 𝑧𝜎 where n is the sample size and is the population standard deviation. √𝑛 𝑧𝜎 𝑧𝜎 The confidence interval for the population mean is then 𝑥̅ − 𝑛 < 𝜇 < 𝑥̅ + 𝑛 √ √ Margin of Error = Example B: If you sampled n=30 men and found they had a sample mean height of 69 inches and standard deviation of 2.5 inches. Round values to the nearest 0.001 (a) Find a 95% confidence interval for the population mean height. (b) Find a 99.7% confidence interval for the population mean height. (c) Find a 90 % confidence interval for the population mean height. (d) If the sample size were increased to 300 men in your state, find a 95% confidence interval for the population of mean height. (e) Compare answers (a) to (d). Did you expect to get these results? Explain?


