topographic
advertisement
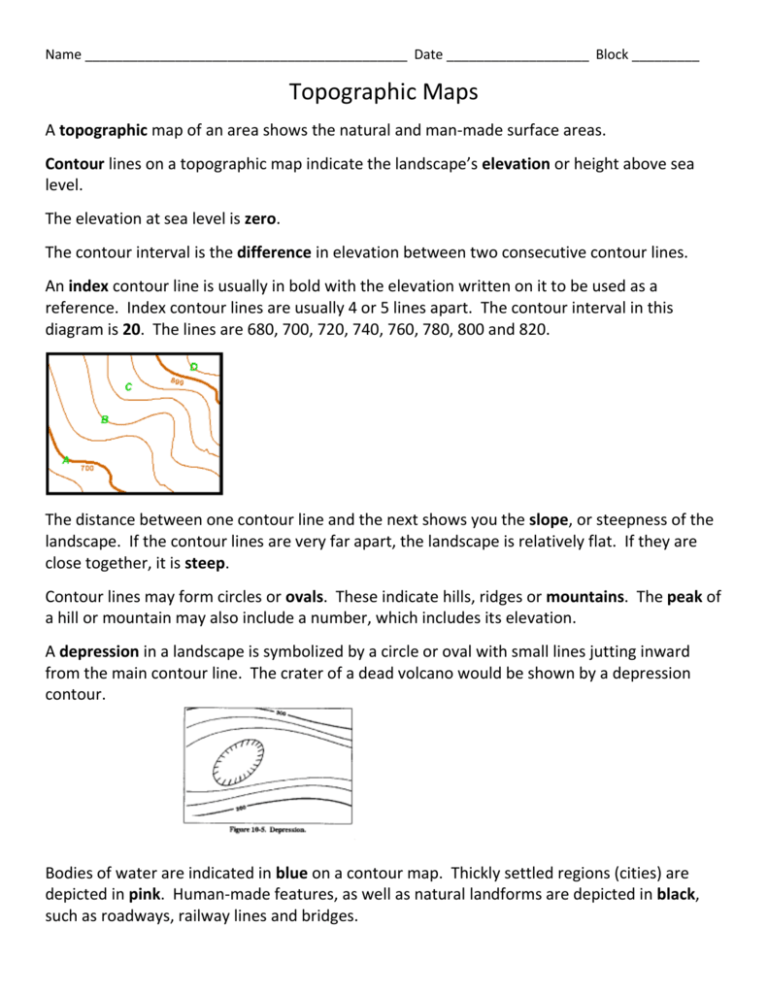
Name ___________________________________________ Date ___________________ Block _________ Topographic Maps A topographic map of an area shows the natural and man-made surface areas. Contour lines on a topographic map indicate the landscape’s elevation or height above sea level. The elevation at sea level is zero. The contour interval is the difference in elevation between two consecutive contour lines. An index contour line is usually in bold with the elevation written on it to be used as a reference. Index contour lines are usually 4 or 5 lines apart. The contour interval in this diagram is 20. The lines are 680, 700, 720, 740, 760, 780, 800 and 820. The distance between one contour line and the next shows you the slope, or steepness of the landscape. If the contour lines are very far apart, the landscape is relatively flat. If they are close together, it is steep. Contour lines may form circles or ovals. These indicate hills, ridges or mountains. The peak of a hill or mountain may also include a number, which includes its elevation. A depression in a landscape is symbolized by a circle or oval with small lines jutting inward from the main contour line. The crater of a dead volcano would be shown by a depression contour. Bodies of water are indicated in blue on a contour map. Thickly settled regions (cities) are depicted in pink. Human-made features, as well as natural landforms are depicted in black, such as roadways, railway lines and bridges.


