Energy Efficient Buildings
advertisement
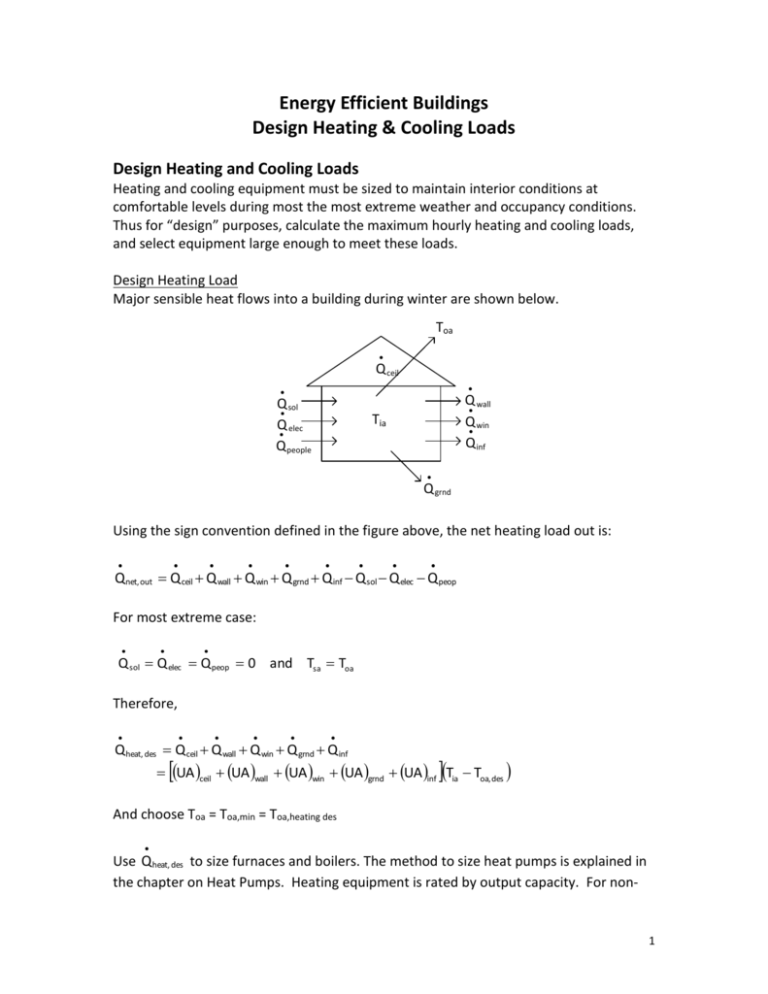
Energy Efficient Buildings Design Heating & Cooling Loads Design Heating and Cooling Loads Heating and cooling equipment must be sized to maintain interior conditions at comfortable levels during most the most extreme weather and occupancy conditions. Thus for “design” purposes, calculate the maximum hourly heating and cooling loads, and select equipment large enough to meet these loads. Design Heating Load Major sensible heat flows into a building during winter are shown below. Toa Q ceil Q sol Q elec Q people Q wall Q win Q inf Tia Q grnd Using the sign convention defined in the figure above, the net heating load out is: Q net, out Q ceil Q wall Q win Q grnd Q inf Q sol Q elec Qpeop For most extreme case: Q sol Q elec Q peop 0 and Tsa Toa Therefore, Q heat, des Q ceil Q wall Q win Q grnd Q inf UA ceil UA wall UA win UA grnd UA inf Tia Toa, des And choose Toa = Toa,min = Toa,heating des Use Q heat, des to size furnaces and boilers. The method to size heat pumps is explained in the chapter on Heat Pumps. Heating equipment is rated by output capacity. For non- 1 Btu standard sizes, round up. For example, if Q heat, des 58,000 , then specify a furnace hr Btu with an output capacity of 60,000 hr Design Cooling Load Major sensible heat flows into a building during summer are shown below. Toa Q ceil Q sol Q elec Q people Q wall Q win Q inf Tia Q grnd Using the sign convention defined in the figure above, the net cooling load in is: Q net,in Q ceil Q wall Q win Q inf Q sol Q elec Q peop Q grnd To create the design heat load, consider the most extreme cases when: I Imax Q sol,max Q people, max Q elec, max Use Tsa Toa Q inf Q sen Q lat Iα h ω I Imax oa ωoa, max Then Q net, in Q cool,des And choose: Toa Toa,max Toa,cooling des oa oa,max oa,cooling des I I max 2 Most cooling equipment is rated in “tons” of cooling capacity, where: Btu 1 ton 12,000 . hr Use Q cool,des to specify the size of cooling equipment. For non-standard sizes, round up. For example, if 1 ton h Btu Btu Q cool,des 34,000 34,000 hr 12,000 Btu 2.8 tons hr then specify a “3.0-ton” air conditioner. Design Weather Conditions Ambient Temperature and Humidity For calculating peak heating and cooling loads, ASHRAE tabulates the minimum and maximum outdoor air temperatures and coincident outdoor humidity that is likely to occur for hundreds of U.S. cities. For peak heating load calculations, ASHRAE publishes the “99.6%” and “99.0%” design conditions, meaning that the actual hourly temperatures were greater (warmer) than the design temperature 99.6% or 99.0% of all annual hours. The peak heating load design temperatures for Dayton, OH are shown below. To ensure that the heating system is large enough to handle the coldest expected temperatures, use the 99.6% design temperature. For peak cooling load calculations, ASHRAE publishes the “0.4%” and “1.0%” design conditions for temperature (Tdb) and humidity (Twb & Tdp), such that the actual hourly temperatures were greater (warmer) than the design temperatures 0.4% or 1.0% of all annual hours. In addition, ASHRAE publishes the mean coincident wet bulb temperature (MCWB) for each design condition, which is the mean wet bulb temperature at the specified dry bulb temperature. MCWB temperature is used for calculating peak latent cooling loads. The peak cooling load design temperatures for Dayton, OH are shown below. To ensure that the cooling system is large enough to handle the warmest expected conditions, use the 0.4% design temperatures. For Dayton 99.6% 99% DB -1 °F 5 °F For Dayton DB 0.4% 90 °F 1.0% 88 °F MCWB 74 °F 73 °F 3 The outdoor air specific humidity can be determined from dry bulb and mean coincident wet bulb temperature using a psychrometric chart. Example Determine the specific humidity of air when the dry bulb temperature is 88 F and the wet bulb temperature is 73 F using a psychrometric chart for air at sea level. w(Tdb = 88 F, Twb =73 F) = 0.014 lbw/lba Solar Radiation ASHRAE also publishes a method to calculate peak solar radiation on a surface. An alternative is to use solar radiation data from Typical Meteorological Year files. To use this method, use WeaTran to create a “12 24-hour Day Types” file. To create the file, WeaTran selects a representative 24-hour period for each month, and calculates hourly solar radiation on east, south, west and north exposures from the hourly solar radiation on a horizontal surface published in the TMY3 data. Using this method, peak solar gains can be estimated by selecting the hour with the greatest solar radiation on a horizontal surface from a WeaTran output file of “12 24-hour Day Types”. Example For peak cooling load calculations, find solar radiation on horizontal, east, south, west and north exposures for Sacramento California using the TMY/WeaTran method. Using TMY3 data for Sacramento California, WeaTran selects a representative 24-hour period for each month, and calculates hourly solar radiation on east, south, west and north exposures from the solar radiation on a horizontal surface, and publishes the data in “Sacramento_CA_dt_us.txt”. The peak solar radiation on a horizontal surface in this file is 319 Btu/ft2-hr and occurred on June 24 at 12:00. The column names and record is shown below. Mo Dy Yr Hr Ta(F) Sol-H(Btu/ft2hr) Sol-E(Btu/ft2hr) Sol-S(Btu/ft2hr) Sol-W(Btu/ft2hr) Sol-N(Btu/ft2hr) w(lbw/lba) 06 24 1995 12 80.96 319 91 123 44 44 0.0086 Thus, peak solar radiation for design purposes can be estimated as: Horizontal: 319 Btu/hr-ft2 East: 91 Btu/hr-ft2 South: 123 Btu/hr-ft2 West: 44 Btu/hr-ft2 North: 44 Btu/hr-ft2 4 Ground Temperature In many locations, annual minimum and maximum ambient temperatures occur about 1.5 months after the winter and summer solstices. Thus, February 1 and August 1 are good dates on which to calculate effective ground temperatures for peak heating and cooling load calculations. A good estimate of effective ground temperature on these dates for load calculations can be derived from TMY3 data and WeaTran “12 24-hour Day Types” data. Example For peak heating and cooling load calculations, find effective ground temperature for Sacramento California using the TMY/WeaTran method. Using TMY3 data for Sacramento California, WeaTran selects a representative 24-hour period for each month and publishes the data in “Sacramento_CA_dt_us.txt”. Effective ground temperature is found using the following formula: Tg = (1.7 Toa,yr + 1.0 Toa,3mo) / 2.7 From “Sacramento_CA_dt_us.txt”, the average annual air temperature is: Ta,avg = 59.94 F From “Sacramento_CA_dt_us.txt”, the average air temperature during November, December and January is 47.91 F From “Sacramento_CA_dt_us.txt”, the average air temperature during May, June and July is 69.96 F. Thus, the effective ground temperatures are: Winter: Tg = (1.7 Toa,yr + 1.0 Toa,3mo) / 2.7 = (1.7 x 59.94 F + 1.0 47.91) / 2.7 Winter: Tg = 55.48 F Summer: Tg = (1.7 Toa,yr + 1.0 Toa,3mo) / 2.7 = (1.7 x 59.94 F + 1.0 69.96) / 2.7 Summer: Tg = 63.66F 5
