Part 1
advertisement
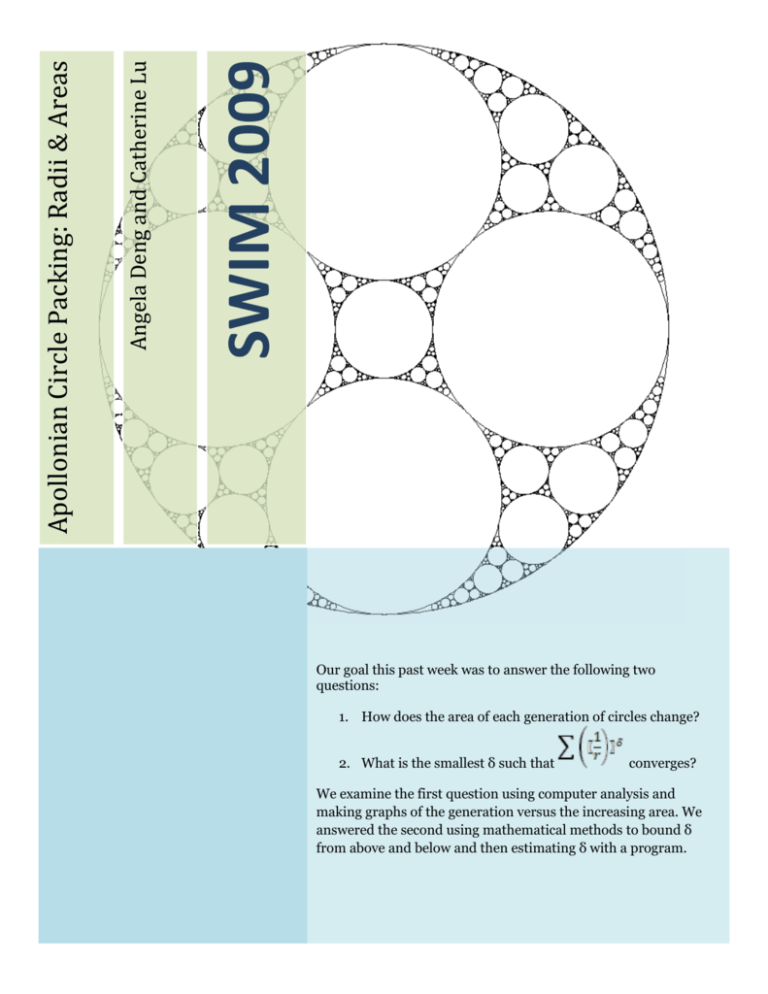
Angela Deng and Catherine Lu Apollonian Circle Packing: Radii & Areas SWIM 2009 Our goal this past week was to answer the following two questions: 1. How does the area of each generation of circles change? 2. What is the smallest δ such that converges? We examine the first question using computer analysis and making graphs of the generation versus the increasing area. We answered the second using mathematical methods to bound δ from above and below and then estimating δ with a program. Our goal was to answer the following two questions: 1. How does area of each generation of circles change? 2. What is the smallest δ such that converges? 1 – Area To see whether the area of each successive generation of ACPs follows a general pattern, we used a program to keep track of the “area” (actually, we disregarded π and defined “area” to be circles from each generation. ) of the Below is a graph we generated using the curvature (-1,2,2,3). Our “first generation” is the area of circles of curvature 2, 2, and 3. Our second generation measures the area of circles with curvature 3, 6, 6, 15 and so on. These curvatures are generated by a program based on the Descarte equation. 0.7 0.6 0.5 0.4 0.3 0.2 0.1 0 1 2 3 4 5 6 7 8 9 10 We looked at other ACPs and the graphs we got all seemed very similar. So, we plotted the increasing areas by the percentage of the large outer circle (in (-1,2,2,3), this would be -1): 70 70 60 60 50 Percentage Percentage 50 40 30 40 30 20 20 10 10 0 0 1 2 3 (-1, 2, 2, 3) 4 5 6 7 8 9 10 1 2 3 4 (-6, 11, 14, 15) 5 6 7 8 9 10 There are some small differences between the two percentages, but overall they are very similar. We found this similar regression with each difference APC we inputted. It does not seem that we can develop a sort of function for the rate of change of area without taking to account the specific ACP, which was our original intention, but it is possible to make very good estimates for change in area per generation based on this general pattern. 2 – Radii Convergence We began by first looking at the summation , or the summation of the areas. With each subsequent generation, the cumulative area will approach that of the largest circle, since more and more space is filled: Therefore, converges to twice the radius squared of the largest circle in the packing. The exception is the ACP (0, 0, 1, 1) since the lines stretch on forever: Now what about the sum of all the radii in the circles of an ACP? We are going to prove that this diverges by using an ACP of a unit circle. We will draw an arbitrary line perpendicular to the diameter of the ACP: No matter where we draw this line, it will pass through infinitely many circles. (Can you convince yourself of this?) We can project all the circles and the line onto the diameter of this circle so that we are left with the diameter and the “shadows” of these projections on the diameter. The line becomes a point on the diameter and all the circles it ran through become lines that contain the point. The projected circles are not completely on the line in the picture for a clearer view: … … Now, we employ the use of the Borel-Cantelli lemma which states the following: If the sum of the probabilities of the En is finite then the probability that infinitely many of them occur is 0, that is, (Wikipedia) Because the diameter of our unit circle is 2, the probability that a line of length Dn is found on a specific location is equivalent to the length of the radius, Rn by . So, the equivalent statement of the lemma in our case is the following: If the sum of the diameters of the projected circles Dn is finite, , then there is no chance that infinitely many lines pass through a single point. In fact, there is a probability of 1 that infinitely many lines will pass through a single point. So, by contradiction, . We now know that 1 < δ < 2. We wrote a computer program to plot the cumulative areas for different magnitudes of δ and ran regression for a logistic curve. We then differentiated the function and analyzed the value of δ such that the slope changed from positive to negative. We found it to be 1.2 < δ < 1.4. People before us have a more precise estimate of the Hausdorff dimension for the ACP as δ=1.30568 with uncertainty of at most 1 in the last digit.
