Appendix 5. Characteristics of the included studies Study Study
advertisement
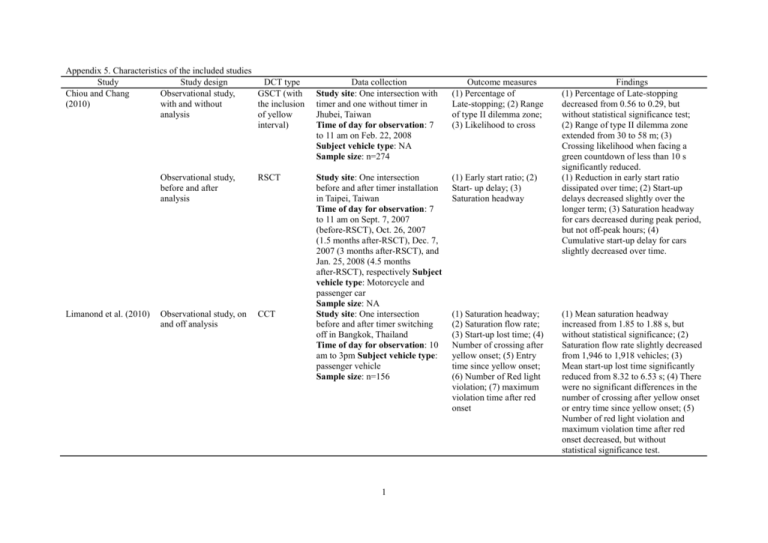
Appendix 5. Characteristics of the included studies Study Study design DCT type Chiou and Chang Observational study, GSCT (with (2010) with and without the inclusion analysis of yellow interval) Limanond et al. (2010) Observational study, before and after analysis RSCT Observational study, on and off analysis CCT Data collection Study site: One intersection with timer and one without timer in Jhubei, Taiwan Time of day for observation: 7 to 11 am on Feb. 22, 2008 Subject vehicle type: NA Sample size: n=274 Outcome measures (1) Percentage of Late-stopping; (2) Range of type II dilemma zone; (3) Likelihood to cross Study site: One intersection before and after timer installation in Taipei, Taiwan Time of day for observation: 7 to 11 am on Sept. 7, 2007 (before-RSCT), Oct. 26, 2007 (1.5 months after-RSCT), Dec. 7, 2007 (3 months after-RSCT), and Jan. 25, 2008 (4.5 months after-RSCT), respectively Subject vehicle type: Motorcycle and passenger car Sample size: NA Study site: One intersection before and after timer switching off in Bangkok, Thailand Time of day for observation: 10 am to 3pm Subject vehicle type: passenger vehicle Sample size: n=156 (1) Early start ratio; (2) Start- up delay; (3) Saturation headway 1 (1) Saturation headway; (2) Saturation flow rate; (3) Start-up lost time; (4) Number of crossing after yellow onset; (5) Entry time since yellow onset; (6) Number of Red light violation; (7) maximum violation time after red onset Findings (1) Percentage of Late-stopping decreased from 0.56 to 0.29, but without statistical significance test; (2) Range of type II dilemma zone extended from 30 to 58 m; (3) Crossing likelihood when facing a green countdown of less than 10 s significantly reduced. (1) Reduction in early start ratio dissipated over time; (2) Start-up delays decreased slightly over the longer term; (3) Saturation headway for cars decreased during peak period, but not off-peak hours; (4) Cumulative start-up delay for cars slightly decreased over time. (1) Mean saturation headway increased from 1.85 to 1.88 s, but without statistical significance; (2) Saturation flow rate slightly decreased from 1,946 to 1,918 vehicles; (3) Mean start-up lost time significantly reduced from 8.32 to 6.53 s; (4) There were no significant differences in the number of crossing after yellow onset or entry time since yellow onset; (5) Number of red light violation and maximum violation time after red onset decreased, but without statistical significance test. Appendix 5. Characteristics of the included studies (Continued) Study Study design DCT type Long et al. (2013) Observational study, CCT with and without analysis Ni and Li (2014) Observational study, with and without analysis GSCT (with the inclusion of yellow interval) Sharma et al. (2009) Observational study, with and without analysis CCT Data collection Study site: Two intersections with timer and two without timer in Changsha, China Time of day for observation: 8 to 10 am on 2 successive sunny workdays from Sept. 1 to Sept. 2, 2010 Subject vehicle type: Passenger car Sample size: n=273 Outcome measures (1) Percentage of aggressive cross after yellow onset; (2) Percentage of normal cross after yellow onset; (3) Percentage of normal stop after yellow onset; (4) Percentage of conservative stop after yellow onset; (5) Percentage of normal run-red; (6) Percentage of aggressive run-red Study site: Two intersections with timer and two without timer in Suzhou, China Time of day for observation: 4:30 to 6:00 pm on a Wednesday and 7:00 to 9:30 am on a Thursday in March, 2012 Subject vehicle type: Passenger car and very limited bus Sample size: 385 vehicles at intersections with timer and 235 vehicles at intersections without timer Study site: One intersection with timer and one without timer in Chennai, India Time of day for observation: 4:30 to 5:30 pm on each day of total 7 days Subject vehicle type: Passenger car, auto-rickshaw, two-wheeler, and bus Sample size: NA (1) Rear-end collision probability during flashing green interval; (2) Rear-end collision likelihood during yellow interval; (3) Type II dilemma zone distribution 2 Gap time Findings (1) Percentage of aggressive cross after yellow onset reduced from 10.0% to 6.1%; (2) Percentage of normal cross after yellow onset increased from 50.9% to 74.2%; (3) Percentage of normal stop after yellow onset decreased from 17.3% to 10.4%; (4) Percentage of conservative stop after yellow onset reduced from 21.8% to 9.2%; (5) Percentage of normal run-red increased from 3.6% to 9.2%; (6) Percentage of aggressive run-red increased from 3.6% to 4.3%. (1) GSCT increased the rear-end collision probability during flashing green interval, especially for vehicles in a zone ranging from 15 to 70 m; (2) GSCT reduced the rear-end collision likelihood during yellow interval, especially for vehicles in a zone ranging from 0 to 50 m; (3) Range of type II dilemma zone shortened and moved away from the stop line during both flashing green and yellow intervals. Gap time nearly kept constant initially and then decreased towards the end of green light under heterogeneous traffic conditions. Appendix 5. Characteristics of the included studies (Continued) Study Study design DCT type Long et al. (2011) Observational study, CCT with and without analysis Huang et al. (2014) Observational study, with and without analysis GSCT (with the inclusion of yellow interval) Data collection Study site: Two intersections with timer and two without timer in Changsha, China Time of day for observation: 8 to 10 am on 2 successive sunny workdays from Sept. 1 to Sept. 2, 2010 Subject vehicle type: Passenger car Sample size: n=273 Outcome measures (1) Proportion of stopping after yellow onset; (2) Proportion of crossing after yellow onset; (3) Proportion of red light running; (4) Average distance to the stop line for stopping and crossing; (5) Likelihood of stopping at yellow onset; (6) Entry time since yellow onset Study site: Two intersections with timer, two intersections with flashing green (GSFD), and other two common (CSD) intersections in Changsha, China Time of day for observation: 9 to 11 am and 3 to 5 pm from Oct. 15 to Oct. 22, 2012 Subject vehicle type: motorized vehicle Sample size: 200, 200, and 350 vehicles at common, flashing green, and timer signalized intersections, respectively (1) Time point of decision-making before yellow onset; (2) modelling decision-making behavior; (3) Range of type I dilemma zone; (4) stop and go decisions during yellow interval for vehicles in dilemma zone; (5) Red light violation 3 Findings (1) Proportion of stopping after yellow onset dropped from 41.2 to 21.1 percent; (2) Proportion of crossing after yellow onset rose from 58.7 to 78.8 percent; (3) Proportion of red light running increased from 8.2 to 15.4 percent; (4) Most drivers in a zone between 10 and 30 m chose to cross after yellow onset; (5) Average distance to the stop line for stopping increased from 20.0 to 33.4 m; (6) Average distance to the stop line for crossing reduced from 10.5 to 9 m; (7) Likelihood of stopping at yellow onset significantly decreased; (8) Entry time since yellow onset under with timer condition was longer lasting on average than that under without timer condition. (1) Time point of decision-making before yellow onset under GSCT was earlier than that under GSFD or CSD; (2) Drivers decision- making behaviors under three green signal devices could be modelled by BPNN model; (3) GSCT and GSFD reduced the likelihood of being trapped in type I dilemma zone than CSD; (4) GSCT induced drivers in type I dilemma zone to choose to cross the intersection during yellow interval; (5) Vehicles in type I dilemma zone under GSCT were more likely to violate red light; (6) Red light violation under GSCT was less than that under GSFD and CSD. Appendix 5. Characteristics of the included studies (Continued) Study Study design DCT type Limanond et al. (2009) Observational study, on CCT and off analysis Ma et al. (2010) Observational study, with and without analysis GSCT (with the inclusion of yellow interval) Data collection Study site: One intersection before and after timer switching off in Bangkok, Thailand Time of day for observation: 10:00 to 15:00 (off-peak day time), 20:00 to 22:00 (night time), and 22:00 to 02:00 (late-night time) on Apr. 25 and May 2, 2007 Subject vehicle type: NA Sample size: NA Outcome measures (1) Saturation headway; (2) Saturation flow rate; (3) Start-up lost time; Study site: One intersection with timer and one without timer in Shanghai, China Time of day for observation: 1 to 4 pm on four weekdays in May, 2009 Subject vehicle type: NA Sample size: n=1695 (1) Vehicular passing speed at the stop line during yellow phase; (2) Vehicular speed evolution during yellow interval; (3) Type I dilemma zone distribution; (4) Number of crossing after yellow onset; (5) Number of red light violation 4 Findings (1) Mean saturation headway significantly decreased from 1.94 to 2.05 s during night time, but not during off-peak day time and late night time; (2) Saturation flow rate noticeably increased from 1,756 to 1,855 vehicles during night time; (3) Mean start-up lost time significantly decreased during three study periods (i.e., from 8.32 to 6.53 s during day time; from 5.92 to 4.92 s during night time; and 5.95 to 4.03 s during late-night time). (1) Mean vehicular passing speed at the stop line during yellow phase significantly increased from 20.5 to 26.4 km/h; (2) GSCT smoothed the driver’s response to the phase change; (3) GSCT effectively eliminated type I dilemma zone; (4) Number of crossing after yellow onset noticeably increased from 196 to 251; (5) Number of red light violation noticeably decreased from 26 to 3. Appendix 5. Characteristics of the included studies (Continued) Study Study design DCT type Sharma et al. (2012) Observational study, CCT before and after analysis Data collection Study site: One intersection before and after timer switching on in Chennai, India Time of day for observation: 11 am to 12 pm for 10 days (five days with timer on and five days with timer off) Subject vehicle type: car, bus, two-wheeler, and auto-rickshaw Sample size: 4,914 cars, 174 buses, 7,276 two-wheelers, and 1,438 auto-rickshaws under with timer condition; 4,311 cars, 192 buses, 6,800 two-wheelers, and 1,431 auto-rickshaws under without timer condition 5 Outcome measures (1) Discharge headway; (2) Propensity of red light violation; (3) Intensity of red light violation; (4) Number of red light violation Findings (1) Significant change in the queue discharge models when timer being presented; (2) Headway of two-wheeler significantly decreased for first 10s of green; (3) Propensity of red light violation decreased from 59 to 31 percent at red start, but increased from 12 to 75 percent at red end; (4) Intensity of red light violation dropped from 3.32 to 2.30 vehicles at red start and from 8.52 to 85.60 vehicles at red end; (5) CCT resulted in an overall increase in propensity (from 64 to 85 percent) and intensity (from 4.69 to 5.74 vehicles) of red light violation; (6) Number of red light violation for two-wheelers and cars significantly increased at red start; (7) Number of red light violation for two-wheelers, auto-rickshaws and cars significantly increased at red end. Appendix 5. Characteristics of the included studies (Continued) Study Study design DCT type Liu et al. (2012) Observational study, CCT with and without analysis Lum and Halim (2006) Observational study, before and after analysis GSCT (without the inclusion of yellow interval) Data collection Study site: Nine intersection approaches with timer and four without timer in Jiangshu Province, China Time of day for observation: weekday peak periods Subject vehicle type: NA Sample size: n=6758 Outcome measures (1) Saturation headway; (2) Start-up lost time; (3) discharge headway compression Study site: One intersection before and after timer installation in Singapore Time of day for observation: four continuous days from Sunday to Wednesday before-GSCT installation and at 1.5-month, 4.5- month, and 7.5-month after-GSCT installation Subject vehicle type: NA Sample size: 74,814 vehicles before-GSCT installation, 77,131 vehicles at 1.5-month after-GSCT installation, 73,390 vehicles at 4.5- month after-GSCT installation, and 78,672 vehicles at 7.5-month after-GSCT installation (1) Number of red light violation; (2) Number of red stopping action 6 Findings (1) Mean saturation headway for protected left-turn movements increased from 2.15 to 2.26 s, but without statistical significance; (2) Mean saturation headway for through movements significantly increased from 2.20 to 2.35 s; (3) Mean start-up lost time for protected left-turn movements significantly dropped from 3.55 to 2.95 s; (4) Mean start-up lost time for through movements significantly reduced from 4.72 to 2.47 s; (5) For protected left-turn movements, headway compression began when 5 s remain in the left-turn green time; (6) For through movements, headway compression began when 15 s remain in the through green time. (1) Number of red light violation significantly reduced at 1.5-month after GSCT installation; (2) Impact of GSCT on the reduction in red light violation tended to dissipate over time, but the number of red light violation was still below the original value; (3) Number of red stopping action significantly increased over the longer term. Appendix 5. Characteristics of the included studies (Continued) Study Study design DCT type Rijavec et al. (2013) Observational study, CCT on-off-on analysis Raksuntorn (2012) Observational study, on and off analysis RSCT Data collection Study site: One intersection (before and after timer turning off, then turning on again) in Liubljana, Slovenia Time of day for observation: Afternoon hours on Aug. 12 and Aug. 16-17, 2010 (timer on), Aug. 18-19 and Aug. 23-24, 2010 (timer off), and Aug. 26 , 2010 ( timer on again) Subject vehicle type: passenger car Sample size: NA Outcome measures (1) Saturation headway; (2) Start-up lost time; (3) Proportion of signal light violation Study site: Thirty intersections before and after timer turning off in Bangkok, Thailand Time of day for observation: During sunny days Subject vehicle type: passenger car Sample size: NA (1) Saturation headway; (2) start-up lost time 7 Findings (1) No significant differences in mean saturation headway were found across before and after timer turning off or before and after timer truing on again; (2) No significant differences in mean start-up lost time were found across before and after timer turning off or before and after timer truing on again; (3) Proportion of signal lights (yellow, red, and red/yellow) increased after timer turning off, but bounced back to original values after subsequent turning on, however, these differences were not verified by statistical significance test. (1) No significant difference in average saturation headway was found before and after timer turning off; (2) Start-up lost time significantly decreased from 4.3 to 2.9 s, when timer was in use.
