Graph Drills - MAEDA AP Chemistry
advertisement
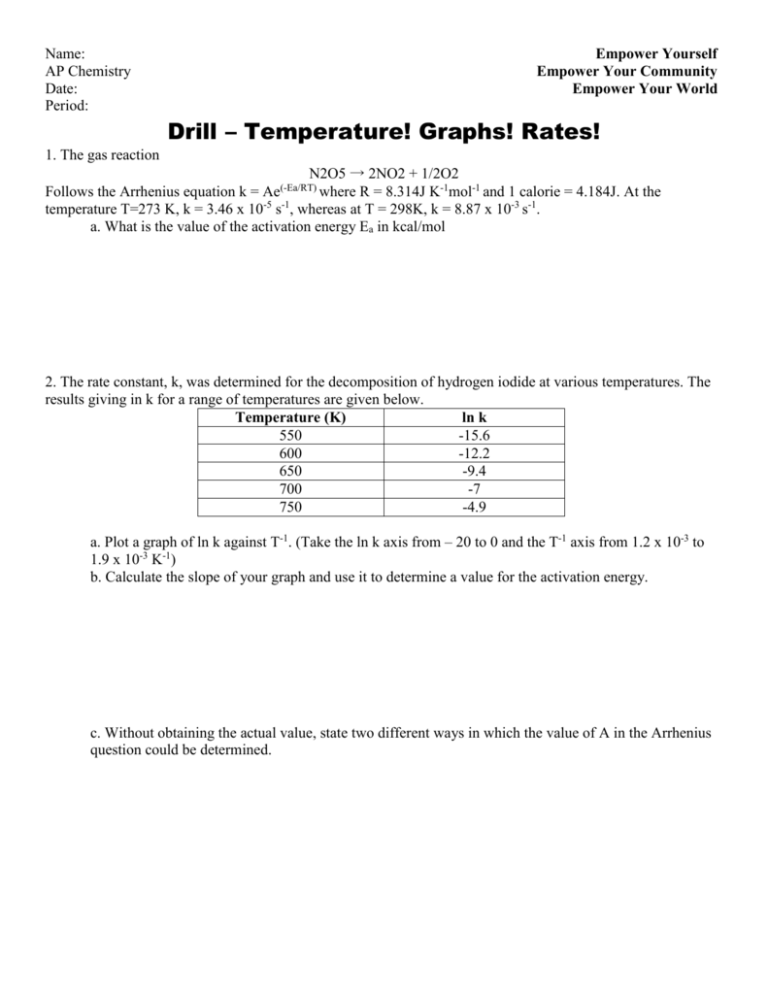
Name: AP Chemistry Date: Period: Empower Yourself Empower Your Community Empower Your World Drill – Temperature! Graphs! Rates! 1. The gas reaction N2O5 → 2NO2 + 1/2O2 Follows the Arrhenius equation k = Ae where R = 8.314J K-1mol-1 and 1 calorie = 4.184J. At the -5 -1 temperature T=273 K, k = 3.46 x 10 s , whereas at T = 298K, k = 8.87 x 10⁻³ s-1. a. What is the value of the activation energy Ea in kcal/mol (-Ea/RT) 2. The rate constant, k, was determined for the decomposition of hydrogen iodide at various temperatures. The results giving in k for a range of temperatures are given below. Temperature (K) ln k 550 -15.6 600 -12.2 650 -9.4 700 -7 750 -4.9 a. Plot a graph of ln k against T-1. (Take the ln k axis from – 20 to 0 and the T-1 axis from 1.2 x 10⁻³ to 1.9 x 10⁻³ K-1) b. Calculate the slope of your graph and use it to determine a value for the activation energy. c. Without obtaining the actual value, state two different ways in which the value of A in the Arrhenius question could be determined. Name: Empower Yourself AP Chemistry Empower Your Community Date: Empower Your World Period: 3. The rate constants for the decomposition of ethanol: CH3CHO CH4 + CO Were measured at five different temperature, the data are shown in the table below: Temperature (K) k (M-1s-1) 700 0.011 730 0.035 760 0.105 790 0.343 810 0.789 Plot ln k verses 1/T and determine Ea for the above reaction 4. Draw the graphs for Zero, First, and Second Order reactions and explain how these can help you determine the rate constant for the reaction of interest


