Carbon Reduction Routemap – Executive Summary
advertisement
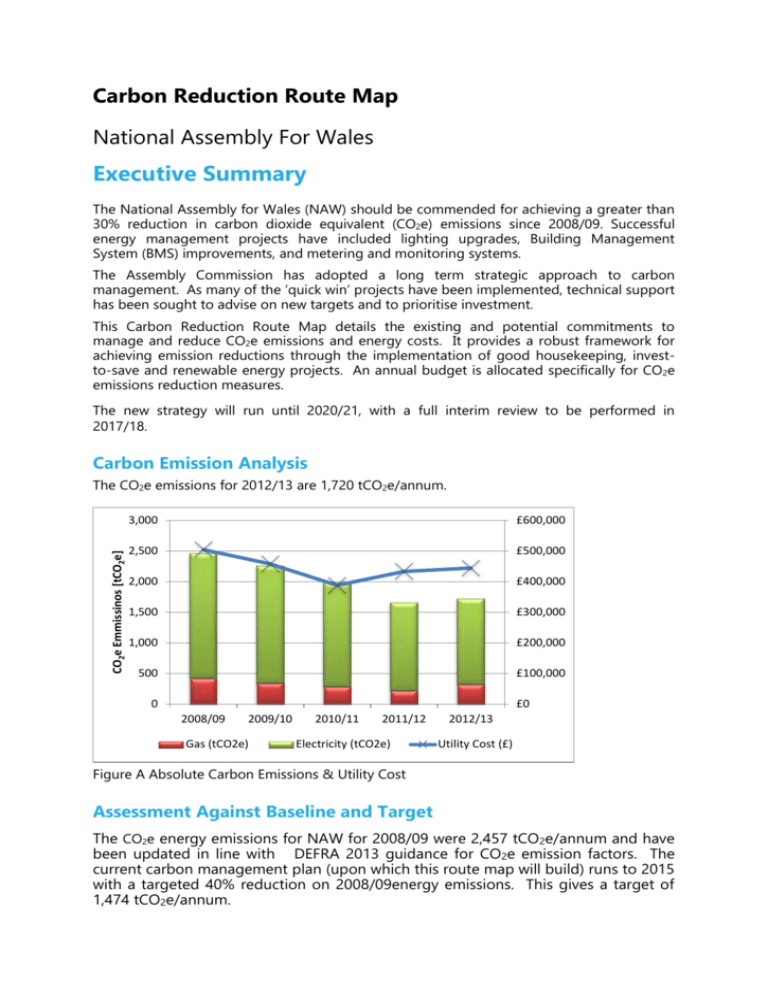
Carbon Reduction Route Map National Assembly For Wales Executive Summary The National Assembly for Wales (NAW) should be commended for achieving a greater than 30% reduction in carbon dioxide equivalent (CO2e) emissions since 2008/09. Successful energy management projects have included lighting upgrades, Building Management System (BMS) improvements, and metering and monitoring systems. The Assembly Commission has adopted a long term strategic approach to carbon management. As many of the ‘quick win’ projects have been implemented, technical support has been sought to advise on new targets and to prioritise investment. This Carbon Reduction Route Map details the existing and potential commitments to manage and reduce CO2e emissions and energy costs. It provides a robust framework for achieving emission reductions through the implementation of good housekeeping, investto-save and renewable energy projects. An annual budget is allocated specifically for CO2e emissions reduction measures. The new strategy will run until 2020/21, with a full interim review to be performed in 2017/18. Carbon Emission Analysis CO2e Emmissinos [tCO2e] The CO2e emissions for 2012/13 are 1,720 tCO2e/annum. 3,000 £600,000 2,500 £500,000 2,000 £400,000 1,500 £300,000 1,000 £200,000 500 £100,000 0 £0 2008/09 2009/10 Gas (tCO2e) 2010/11 2011/12 Electricity (tCO2e) 2012/13 Utility Cost (£) Figure A Absolute Carbon Emissions & Utility Cost Assessment Against Baseline and Target The CO2e energy emissions for NAW for 2008/09 were 2,457 tCO2e/annum and have been updated in line with DEFRA 2013 guidance for CO2e emission factors. The current carbon management plan (upon which this route map will build) runs to 2015 with a targeted 40% reduction on 2008/09energy emissions. This gives a target of 1,474 tCO2e/annum. Without further interventions to manage emissions the NAW will not achieve its existing target. However, achieving the targets will insulate the Assembly against increasing utility costs, and will enhance institutional reputation and overall sustainability. Financial and CO2e Options Evaluation Energy consumption for existing buildings can initially be minimised by driving down energy demand (through passive building design and operation techniques) before focusing on energy efficient plant and controls. As part of this study the energy performance of Tŷ Hywel, Pierhead Building and the Senedd was surveyed and recommendations made. Table A - Building Survey Initiatives Summary Initiatives Cost Saving [£/year] CO2e Savings [tCO2e/annum] Cost [£] Estimated Payback [Years] Good Housekeeping £42,250 168 tCO2e (9.8%) Absorbed current budgets Immediate Invest to Save £85,545 347 tCO2e (20.2%) £726,500 8.5 years £127,795 515 tCO2e (30.0%) £726,500 - Total Opportunities for integrating Renewable Technologies into the strategy have been reviewed for further feasibility assessment. These require a high commitment and a risk management based approach. The interventions are demonstrated graphically to highlight the possible CO2e reduction initiatives that could be implemented. Renewables Photovoltaics Solar thermal High commitment, risk management 4% Invest To Save Electrical auditing/labelling Lighting & controls Boiler/cooling replacement Mature technologies, Medium investment 20% Good Housekeeping Metering & targeting Behaviour change & training Regular inspection & auditing Low cost but requires human resources 10% 1 2 Figure B CO2e Reduction Initiatives Implementation Plan Targets Table B - Summary of targets Year Short Term Medium Term Long Term Target Strategy Focus 2015 10% Focus on implementing Good Housekeeping measures and develop invest to save initiatives funding. 2017/18 10% Complete invest to save initiatives. It would be advisable to allocate 10% of the more readily achievable target savings in the medium term with the remainder in the long term. 2021 10% Target the remaining 10% of the invest to save initiatives, and allocate budget to investigate use of renewable energy. Implementation Plan The projection below highlights how the absolute reduction in CO2e emissions could be attained through targeted reduction interventions. 3,000 CO2e Emmissinos [tCO2e] 2,500 2,000 1,500 1,000 500 0 Actual Emissions BaU % Emissions (no interventions) NAW Reforcast Target Figure C Implementation Plan CO2e Emission Projections The capital cost of the interventions exclude inflation/other cost increases during the period. If these initiatives are addressed the following business case would be demonstrated: Recommended £100,000 annual budget for works Total utility cost value at stake estimated £128,000 Good Housekeeping 168 tCO2e (10%) CO2e emissions reduction Invest to Save 347 tCO2e (20%) CO2e emissions reduction An overall payback of 8.5 years Renewable Technologies excluded from target 5% 6% Pierhead Senedd 29% 60% Tŷ Hywel Joint Initiatives Figure D Implementation Plan CO2e Emission Savings by Building £700,000 £600,000 Utility Cost £500,000 £400,000 £300,000 £200,000 £100,000 £0 Actual Utility Cost Projected Utility Cost Implementation Plan Projected Utility Costs Figure E Implementation Plan Utility Cost Projections Under this scenario NAW is set to achieve its challenging carbon management targets, utility costs will be managed and the associated risks reduced. IMPORTANT NOTICE All costs and savings stated in this report are based on the data available at the time of the report.


