lesson plans for March 23
advertisement
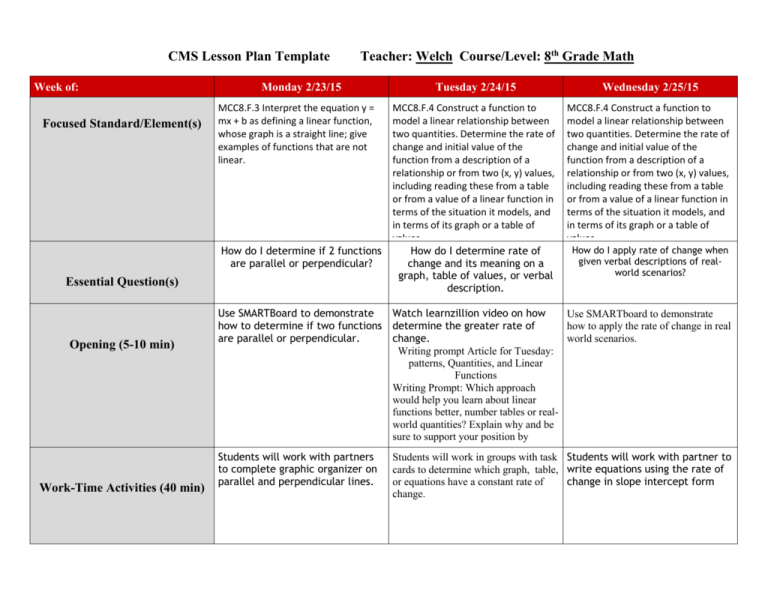
CMS Lesson Plan Template Week of: Focused Standard/Element(s) Teacher: Welch Course/Level: 8th Grade Math Monday 2/23/15 MCC8.F.3 Interpret the equation y = mx + b as defining a linear function, whose graph is a straight line; give examples of functions that are not linear. How do I determine if 2 functions are parallel or perpendicular? Essential Question(s) Opening (5-10 min) Work-Time Activities (40 min) Tuesday 2/24/15 Wednesday 2/25/15 MCC8.F.4 Construct a function to model a linear relationship between two quantities. Determine the rate of change and initial value of the function from a description of a relationship or from two (x, y) values, including reading these from a table or from a value of a linear function in terms of the situation it models, and in terms of its graph or a table of values. How do I determine rate of change and its meaning on a graph, table of values, or verbal description. MCC8.F.4 Construct a function to model a linear relationship between two quantities. Determine the rate of change and initial value of the function from a description of a relationship or from two (x, y) values, including reading these from a table or from a value of a linear function in terms of the situation it models, and in terms of its graph or a table of values. Use SMARTBoard to demonstrate Watch learnzillion video on how how to determine if two functions determine the greater rate of are parallel or perpendicular. change. Writing prompt Article for Tuesday: patterns, Quantities, and Linear Functions Writing Prompt: Which approach would help you learn about linear functions better, number tables or realworld quantities? Explain why and be sure to support your position by referencing the text. Students will work with partners Students will work in groups with task to complete graphic organizer on cards to determine which graph, table, parallel and perpendicular lines. or equations have a constant rate of change. How do I apply rate of change when given verbal descriptions of realworld scenarios? Use SMARTboard to demonstrate how to apply the rate of change in real world scenarios. Students will work with partner to write equations using the rate of change in slope intercept form Closure Activity (10 min) Students will create equations that represents parallel and perpendicular lines. • Differentiation Strategies • Think aloud over writing the rule for functions Peer tutoring Students will complete a ticket out the door to determine their understanding of rate of change. • • Peer Tutoring Chunking Students will be given an exit slip with 2 functions on it and must explain how determine which has the greatest rate of change. • • Partners Think aloud (targeting student growth) Focused Standard/Element(s) Essential Question(s) Thursday 2/26/15 Friday 2/27/15 MCC8.F.4 Construct a function to model a linear relationship between two quantities. Determine the rate of change and initial value of the function from a description of a relationship or from two (x, y) values, including reading these from a table or from a value of a linear function in terms of the situation it models, and in terms of its graph or a table of values. How do I Apply linear functions by modeling profits and expenses in a real-world situation MCC8.F.4 Construct a function to model a linear relationship between two quantities. Determine the rate of change and initial value of the function from a description of a relationship or from two (x, y) values, including reading these from a table or from a value of a linear function in terms of the situation it models, and in terms of its graph or a table of values. How do I Apply linear functions by modeling profits and expenses in a real-world situation Additional Notes Writing prompt Article for Tuesday: patterns, Quantities, and Linear Functions Writing Prompt: Which approach would help you learn about linear functions better, number tables or realworld quantities? Explain why and be sure to support your position by referencing the text. Opening (5-10 min) Work-Time Activities (40 min) Closure Activity (10 min) Differentiation Strategies (targeting student growth) Watch Learnzillion video lesson on how to apply functions by modeling profits and e Penske in real-world situations. Given 2 real world scenarios, students will use hunk aloud to determine the rate of change and equation for each. Students will work in groups and will rotate stations where each station will have a different real-world scenario where students will apply linear functions to determine the rate of change and write the equation for each. Based on the closure activity from Thursday, students will be placed in groups for peer tutoring and complete handout on real-world scenarios and determine rate of change and equation. On an index card students will Students will create their own realevaluate their level of world scenarios and share with class. understanding by of applying functions to real-world scenarios by writing their name on the card along with a "1" for still confused, "2" but still need practice, or "3" for understand and don't need any practice. • • Tiered instruction Groups • • Peer tutoring Think, pair, share
