File
advertisement
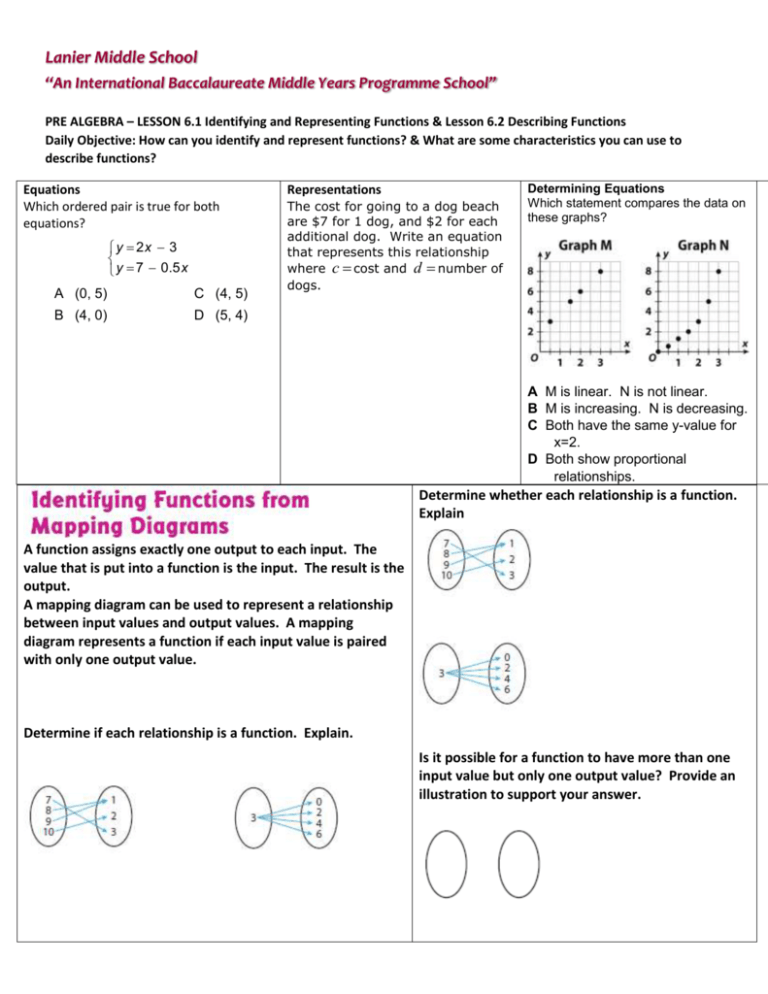
Lanier Middle School “An International Baccalaureate Middle Years Programme School” PRE ALGEBRA – LESSON 6.1 Identifying and Representing Functions & Lesson 6.2 Describing Functions Daily Objective: How can you identify and represent functions? & What are some characteristics you can use to describe functions? Equations Which ordered pair is true for both equations? y 2x 3 y 7 0.5 x A (0, 5) C (4, 5) B (4, 0) D (5, 4) Representations The cost for going to a dog beach are $7 for 1 dog, and $2 for each additional dog. Write an equation that represents this relationship where c cost and d number of dogs. Determining Equations Which statement compares the data on these graphs? A M is linear. N is not linear. B M is increasing. N is decreasing. C Both have the same y-value for x=2. D Both show proportional relationships. Determine whether each relationship is a function. Explain A function assigns exactly one output to each input. The value that is put into a function is the input. The result is the output. A mapping diagram can be used to represent a relationship between input values and output values. A mapping diagram represents a function if each input value is paired with only one output value. Determine if each relationship is a function. Explain. Is it possible for a function to have more than one input value but only one output value? Provide an illustration to support your answer. Lanier Middle School “An International Baccalaureate Middle Years Programme School” Relationships between input values and output values can also be represented using tables. The values in the first column are the input values. The values in the second column are the output values. The relationship represented a function if each input value is paired with only out output value. What is always true about the numbers in the first column of a table that represents a function? Why must this be true? Determine if each relationship is a function. Explain. The graph on the right shows the relationship between the number of hours students spent studying for an exam and the exam grades. Is the relationship represented by the graph a function? The graph on the right shows the relationship between the heights and weights of the members of a basketball team. Is the relationship represented by the graph a function? Explain. Lanier Middle School “An International Baccalaureate Middle Years Programme School” Independent and Group Practice Complete each table. In the row with x as the input, write the rule as an algebraic expression for the output. Then complete the last row of the table using the rule. Determine if each relationship is a function. 6 The graph shows the relationship between the weights of 5 packages and the shipping charge for each package. Is the relationship represented by the graph a function? Explain. Determine whether each relationship represented by the ordered pairs is a function. Explain. Lanier Middle School “An International Baccalaureate Middle Years Programme School” 10 Joaquin receives $0.40 per pound for 1 to 99 pounds of aluminum cans he recycles. He receives $0.50 per pound if he recycles more than 100 pounds. Is the amount of money Joaquin receives a function of the weight of the cans he recycles? Explain your reasoning. 11 A biologist tracked the growth of a strain of bacteria, as shown in the graph. Explain why the relationship represented by the graph is a function. Suppose there was the same number of bacteria for two consecutive hours. Would the graph still represent a function? Explain. 12 Give an example of a function in everyday life, and represent it as a graph, table, and a set of ordered pairs. Describe how you know it is a function. The graph shows the relationship between the weights of six wedges of cheese and the price of each wedge. 13 Is the relationship represented by the graph a function? Justify your reasoning. Use the words “input” and “output” in your explanation, and connect them to the context represented by the graph. Lanier Middle School “An International Baccalaureate Middle Years Programme School” 14 Suppose the weights and prices of additional wedges of cheese were plotted on the graph. Is that likely to change your answer to question 13? Explain your reasoning. 15 A mapping diagram represents a relationship that contains three different input values and four different output values. Is the relationship a function? Explain your reasoning. The U.S. Department of Agriculture defines heavy rain as rain that falls at a rate of 1.5 centimeters per hour. A. Complete the table. B. C. D. E. F. Plot the ordered pairs from the table on the coordinate plane on the right. How much rain falls in 3.5 hours? Plot the point corresponding to 3.5 hours of heavy rain. What do you notice about all the points you plotted? Is the total amount of rain that falls a function of the number of hours that rain has been falling? Why or why not? Lanier Middle School “An International Baccalaureate Middle Years Programme School” The relationship you investigated in the previous activity can be represented by the equation y 1.5 x, where x is the time and y is the total amount of rain. The graph of the relationship is a line, so the equation is a linear equation. Since there is exactly one value of y for each value of x, the relationship is a function. It is a linear function because its graph is a non-vertical line. Example The temperature at dawn was 8F and increased steadily 2 F every hour. The equation y 2 x 8 gives the temperature y after x hours. State whether the relationship between the time and the temperature is proportional or non-proportional. Then graph the function. The linear equation in the previous example has the form y mx b, where m and b are real numbers. Every equation in the form y mx b, is a linear equation. The linear equations represent linear functions. Equations that cannot be written in this form are not linear equations, and therefore are not linear functions. Example A square tile has a side length of x inches. The equation y x 2 gives the area of the tile in square inches. Determine whether the relationship between x and y is linear and, if so, if it is proportional. Justify your response with mathematical evidence. Plot the ordered pairs from the table. Then graph the function represented by the ordered pairs and tell whether the function is linear or non-linear. Tell whether the function is proportional. Lanier Middle School “An International Baccalaureate Middle Years Programme School” Explain whether each equation is a linear equation. 5 Explain how you can use a table of values, an equation, and a graph to determine whether a function represents a proportional relationship. 6 State whether the relationship between x and y in y 4 x 5 is proportional or non-proportional. Then graph the function. 7 The Fortaleza telescope in Brazil is a radio telescope. Its shape can be approximated with the equation y 0.013x 2 Is the relationship between x and y linear? Is it proportional? Explain. 8 Kiley spent $20 on rides and snacks at the state fair. If x is the amount she spent on rides, and y is the amount she spent on snacks, the total amount she spent can be represented by the equation x y 20. Is the relationship between x and y linear? Is it proportional? Explain. Lanier Middle School “An International Baccalaureate Middle Years Programme School” 9 The drill team is buying new uniforms. The table shows y, the total cost in dollars, and x, the number of uniforms purchased. Use the data to draw a graph. Is the relationship between x and y linear? Explain. Use your graph to predict the cost of purchasing 12 uniforms. 10 Marta, a whale calf in an aquarium, is fed a special milk formula. Her handler uses a graph to track the number of gallons of formula y the calf drinks in x hours. Is the relationship between x and y linear? Is it proportional? Explain. 11 a student claims that the equation y 7 is not a linear equation because it does not have the form y mx b. Do you agree or disagree? Why? 12 Let x represent the number of hours you read a book and y represent the total number of pages you have read. You have already read 70 pages and can read 30 pages per hour. Write an equation relating x hours and y pages you read. Then predict the total number of pages you will have read after another 3 hours. 13 rebecca draws a graph of a real-world relationship that turns out to be a set of unconnected points. Can the relationship be linear? Can it be proportional? Explain your reasoning. 14 Show that the equation y 3 32 x 1 is linear and that it represents a proportional relationship between x and y. Lanier Middle School “An International Baccalaureate Middle Years Programme School” Challenge Problems Closure What are four different ways of representing functions? How can you tell if a relationship is a function? Homework
