Fig - Barley World
advertisement
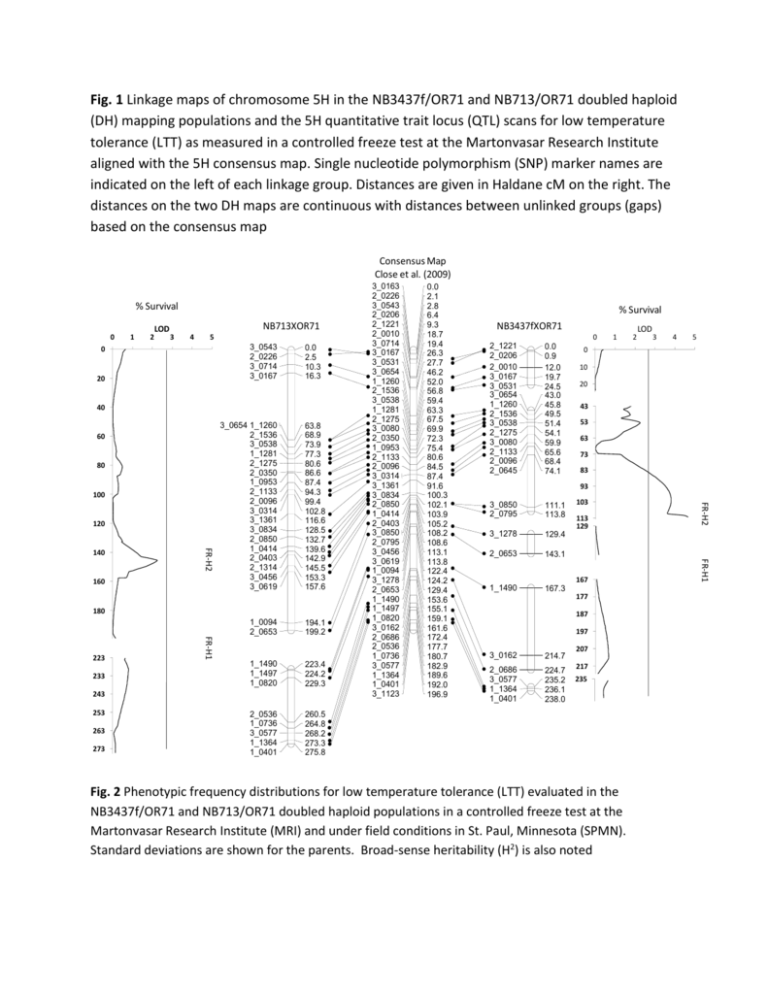
Fig. 1 Linkage maps of chromosome 5H in the NB3437f/OR71 and NB713/OR71 doubled haploid (DH) mapping populations and the 5H quantitative trait locus (QTL) scans for low temperature tolerance (LTT) as measured in a controlled freeze test at the Martonvasar Research Institute aligned with the 5H consensus map. Single nucleotide polymorphism (SNP) marker names are indicated on the left of each linkage group. Distances are given in Haldane cM on the right. The distances on the two DH maps are continuous with distances between unlinked groups (gaps) based on the consensus map Consensus Map Close et al. (2009) % Survival 0 1 2 LOD NB713XOR71 3 4 5 3_0543 2_0226 3_0714 3_0167 0 20 0.0 2.5 10.3 16.3 40 60 80 100 160 180 1_0094 2_0653 233 FR-H1 223 194.1 199.2 1_1490 1_1497 1_0820 223.4 224.2 229.3 2_0536 1_0736 3_0577 1_1364 1_0401 260.5 264.8 268.2 273.3 275.8 243 253 263 273 % Survival NB3437fXOR71 0 2_1221 2_0206 2_0010 3_0167 3_0531 3_0654 1_1260 2_1536 3_0538 2_1275 3_0080 2_1133 2_0096 2_0645 0.0 0.9 12.0 19.7 24.5 43.0 45.8 49.5 51.4 54.1 59.9 65.6 68.4 74.1 1 2 LOD 3 4 5 0 10 20 43 53 63 73 83 93 3_0850 2_0795 111.1 113.8 3_1278 129.4 2_0653 143.1 1_1490 167.3 103 113 129 167 177 187 197 3_0162 214.7 2_0686 3_0577 1_1364 1_0401 224.7 235.2 236.1 238.0 207 217 235 Fig. 2 Phenotypic frequency distributions for low temperature tolerance (LTT) evaluated in the NB3437f/OR71 and NB713/OR71 doubled haploid populations in a controlled freeze test at the Martonvasar Research Institute (MRI) and under field conditions in St. Paul, Minnesota (SPMN). Standard deviations are shown for the parents. Broad-sense heritability (H2) is also noted FR-H1 FR-H2 140 63.8 68.9 73.9 77.3 80.6 86.6 87.4 94.3 99.4 102.8 116.6 128.5 132.7 139.6 142.9 145.5 153.3 157.6 0.0 2.1 2.8 6.4 9.3 18.7 19.4 26.3 27.7 46.2 52.0 56.8 59.4 63.3 67.5 69.9 72.3 75.4 80.6 84.5 87.4 91.6 100.3 102.1 103.9 105.2 108.2 108.6 113.1 113.8 122.4 124.2 129.4 153.6 155.1 159.1 161.6 172.4 177.7 180.7 182.9 189.6 192.0 196.9 FR-H2 120 3_0654 1_1260 2_1536 3_0538 1_1281 2_1275 2_0350 1_0953 2_1133 2_0096 3_0314 3_1361 3_0834 2_0850 1_0414 2_0403 2_1314 3_0456 3_0619 3_0163 2_0226 3_0543 2_0206 2_1221 2_0010 3_0714 3_0167 3_0531 3_0654 1_1260 2_1536 3_0538 1_1281 2_1275 3_0080 2_0350 1_0953 2_1133 2_0096 3_0314 3_1361 3_0834 2_0850 1_0414 2_0403 3_0850 2_0795 3_0456 3_0619 1_0094 3_1278 2_0653 1_1490 1_1497 1_0820 3_0162 2_0686 2_0536 1_0736 3_0577 1_1364 1_0401 3_1123 NB713XOR71 GH LTT MRI H2 = 0.92 40 OR71 (57.8 ± 5.4) Number of Lines Number of Lines NB3437fXOR71 LTT MRI 35 30 25 20 15 10 5 0 NB3437f (86.9 ± 4.1) NB713 (73.3 ± 3.5) 30 OR71 (41.2 ± 3.1) 20 10 0 20 30 40 50 60 70 80 90 100 10 20 30 40 Survival (%) OR71 (16 ± 7.8) 60 70 80 NB713XOR71 LTT SPMN H2 = 0.87 50 NB3437f (100 ± 0) 20 Number of Lines 25 50 90 100 Survival (%) NB3437fXOR71 LTT SPMN Number of Lines H2 = 0.92 15 10 5 0 H2 = 0.64 NB713 (100 ± 0) 40 30 OR71 (6 ± 1.1) 20 10 0 0 10 20 30 40 50 60 Survival (%) 70 80 90 100 0 10 20 30 40 50 60 70 80 90 100 Survival (%) Fig. 3 Quantitative trait locus (QTL) scans on chromosome 1H for low temperature tolerance (LTT) at St. Paul, Minnesota (SPMN) and LTT from the Martonvasar Research Institute (MRI) freeze test. A 20 cM scan window was used for this analysis, which is based on the combined map of two doubled haploid mapping populations: NB3437f/OR71 and NB713/OR71 25 20 LOD 15 SPMN Surival 10 MRI Survival 5 0 0 19 39 59 77 96 116 135 155 173 1H (cM) Fig. 4 Phenotypic frequency distributions for final leaf number (FLN) evaluated for NB3437f/OR71 and NB713/OR71 doubled haploid populations. FLN were measured with and without vernalization (V+, V-) under greenhouse conditions. Standard deviations are shown for the parents when replicated. Broadsense heritability (H2) is also noted NB3437fXOR71 FLN GH (V+) 25 Number of Lines Number of Lines NB713XOR71 FLN GH (V+) H2 = 0.93 NB3437f OR71 (10.5 ± 0.7) (11 ± 0) 30 20 15 10 5 0 8 9 10 11 12 13 14 NB713 (11.5 ± 0.7) 35 30 25 20 15 10 5 0 15 8 9 10 Final Leaf Number 25 Number of Lines Number of Lines 13 14 NB713XOR71 FLN GH (V-) H2 = 0.67 NB3437f (12 ± 0) 40 12 15 Final Leaf Number NB3437fXOR71 FLN GH (V-) 50 11 H2 = 0.92 OR71 (11.5 ± 0.7) OR71 30 20 10 0 OR71 (13.5 ± 0.7) 20 H2 = 0.91 NB713 (15 ± 0) 15 10 5 0 10 11 12 13 14 Final Leaf Number 15 16 17 9 10 11 12 13 14 15 Final Leaf Number 16 17 18
