Energy Priorities Worksheet Example Answers
Name: ____________________________________________ Date: _________________ Class: ______________
Energy Priorities Worksheet Example Answers
Engage:
You are an environmental engineer hired by the state utilities commission to investigate which form of renewable energy they should focus their efforts on as they recruit new companies using a federal renewable energy grant. Your task is to analyze potential energy data using the living lab, and then make recommendations as to what form of energy the state should focus its recruitment efforts on.
With a partner, generate a list of renewable energies. Then, brainstorm possible factors you would want to consider when deciding where to build new sites for each of these energies to be harvested. Compare with the rest of your class.
Explore:
1.
Go to the Renewable Energy Living Laboratory at http://www.teachengineering.org/livinglabs/index.php
.
2.
Choose age group K-12.
3.
Zoom in on your state.
4.
Check the boxes under the Resources folder (located on the left under the Layers tab) to switch between the maps depicting the potential for the five different forms of renewable hydropower, biomass, geothermal, wind and solar. Use the icons in the lower left corner to read more information about each form of energy.
Explain:
Data Analysis
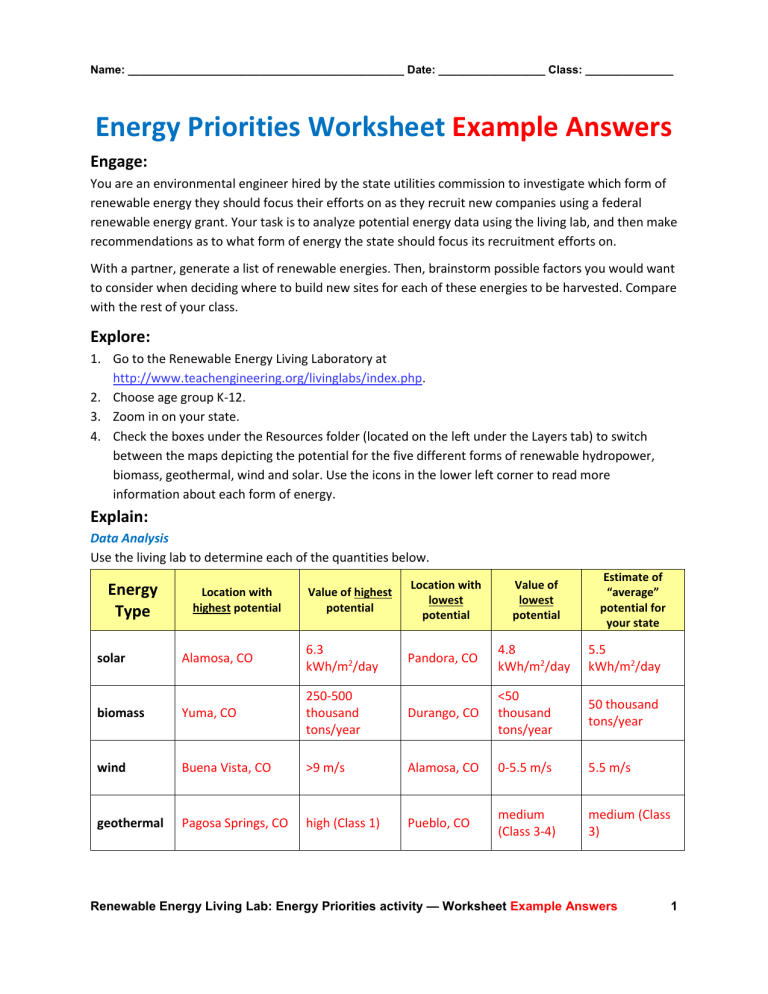
Use the living lab to determine each of the quantities below.
Energy
Type
Location with highest potential
Value of highest potential
Location with lowest potential
Value of lowest potential
Estimate of
“average” potential for your state solar Alamosa, CO
6.3 kWh/m 2 /day
Pandora, CO
4.8 kWh/m 2 /day
5.5 kWh/m 2 /day biomass Yuma, CO
250-500 thousand tons/year
Durango, CO
<50 thousand tons/year
50 thousand tons/year wind Buena Vista, CO >9 m/s Alamosa, CO 0-5.5 m/s 5.5 m/s geothermal Pagosa Springs, CO high (Class 1) Pueblo, CO medium
(Class 3-4) medium (Class
3)
Renewable Energy Living Lab: Energy Priorities activity — Worksheet Example Answers 1
hydropower Fort Collins, CO 250-500 MW Alamosa, CO 0-1 MW 200 MW
Elaborate:
Based upon the data collected in the living lab, answer the questions below.
1.
Explain how you determined the areas of highest potential and lowest potential.
For each source of renewable energy, I searched the Colorado state map with the corresponding layer for colors that matched the colors on the legend scale corresponding to the highest values.
When I determined where the highest potential values occur, I zoomed in to that area on the map to find a name for a city or town in that area. I did the same to find the lowest potential, although in this case I searched for colors matching the colors on the legend scale corresponding to the lowest values.
2.
Describe how you figured out the “average” potential for your state.
To estimate the average potential, I zoomed out so that I could view the entire state at one time. I looked at all the colors present and how the area each color covered, and I made a best guess at the average value represented by these colors.
Evaluate:
1.
Based upon the data in your table, on which renewable energy type would you recommend that the public utilities commission focus their recruitment efforts?
Include evidence from your analysis.
Although areas with the highest possible wind power potential exist (based on the legend scale), those areas were typically on the top of mountain ranges and would be difficult to access. On the other hand, areas with extremely high solar power potential also exist, and throughout the state, the average solar power potential was relatively high. Therefore solar power would be my number one recommendation. Geothermal power potential was class 3 on average and class 5 in a small portion of the state, so this would also be a good renewable energy source to explore. The estimated averages for biomass and hydropower were not as high, based on the legend scale, so I would not recommend those as energy resources to pursue.
2.
Compare your recommended sites to those of another group. How are they similar? How are they different? How do you explain the differences when you used the same data source?
The group I compared with had many different cities or towns listed in its table, but very similar values throughout its data table. I believe this is the case because there are many different areas throughout the state that have the same values for each renewable energy source. In fact, when my group chose each location, we generally had many to choose from for each category because there were many areas throughout the state with the same value for each energy source.
Renewable Energy Living Lab: Energy Priorities activity — Worksheet Example Answers 2
