Algebra I STAAR EOC
advertisement
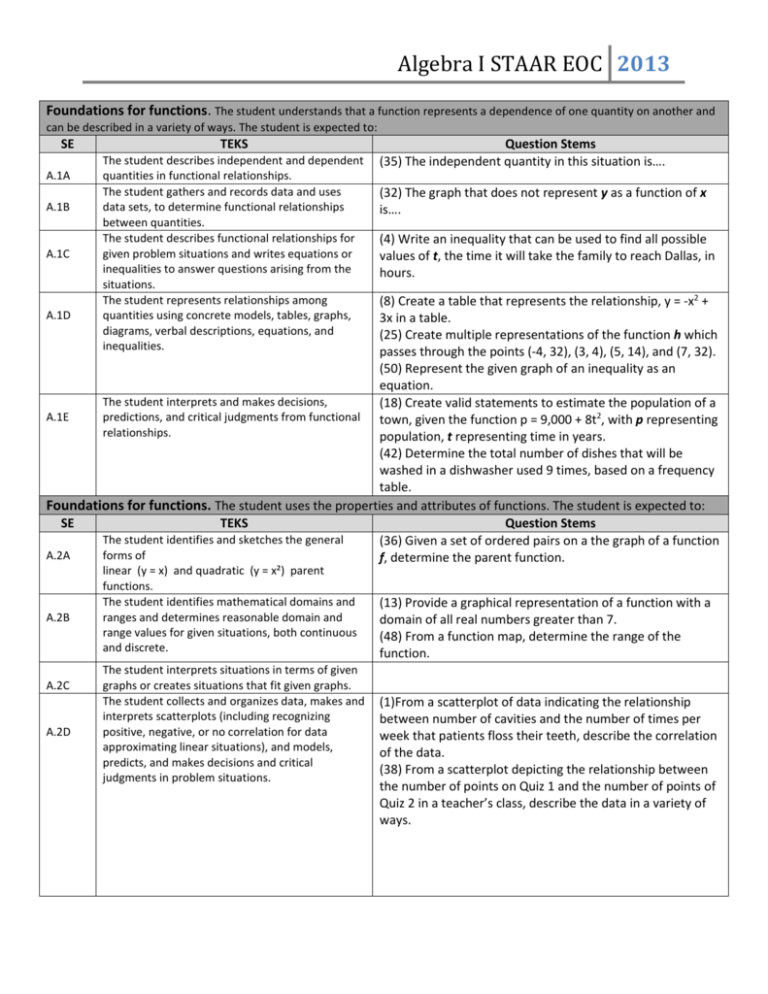
Algebra I STAAR EOC 2013 Foundations for functions. The student understands that a function represents a dependence of one quantity on another and can be described in a variety of ways. The student is expected to: SE A.1A A.1B A.1C TEKS The student describes independent and dependent quantities in functional relationships. The student gathers and records data and uses data sets, to determine functional relationships between quantities. The student describes functional relationships for given problem situations and writes equations or inequalities to answer questions arising from the situations. The student represents relationships among quantities using concrete models, tables, graphs, diagrams, verbal descriptions, equations, and inequalities. Question Stems (35) The independent quantity in this situation is…. (32) The graph that does not represent y as a function of x is…. (4) Write an inequality that can be used to find all possible values of t, the time it will take the family to reach Dallas, in hours. (8) Create a table that represents the relationship, y = -x2 + A.1D 3x in a table. (25) Create multiple representations of the function h which passes through the points (-4, 32), (3, 4), (5, 14), and (7, 32). (50) Represent the given graph of an inequality as an equation. The student interprets and makes decisions, (18) Create valid statements to estimate the population of a A.1E predictions, and critical judgments from functional town, given the function p = 9,000 + 8t2, with p representing relationships. population, t representing time in years. (42) Determine the total number of dishes that will be washed in a dishwasher used 9 times, based on a frequency table. Foundations for functions. The student uses the properties and attributes of functions. The student is expected to: SE TEKS Question Stems The student identifies and sketches the general (36) Given a set of ordered pairs on a the graph of a function A.2A forms of f, determine the parent function. A.2B A.2C A.2D linear (y = x) and quadratic (y = x²) parent functions. The student identifies mathematical domains and ranges and determines reasonable domain and range values for given situations, both continuous and discrete. The student interprets situations in terms of given graphs or creates situations that fit given graphs. The student collects and organizes data, makes and interprets scatterplots (including recognizing positive, negative, or no correlation for data approximating linear situations), and models, predicts, and makes decisions and critical judgments in problem situations. (13) Provide a graphical representation of a function with a domain of all real numbers greater than 7. (48) From a function map, determine the range of the function. (1)From a scatterplot of data indicating the relationship between number of cavities and the number of times per week that patients floss their teeth, describe the correlation of the data. (38) From a scatterplot depicting the relationship between the number of points on Quiz 1 and the number of points of Quiz 2 in a teacher’s class, describe the data in a variety of ways. Algebra I STAAR EOC 2013 Foundations for functions. The student understands how algebra can be used to express generalizations and recognizes and uses the power of symbols to represent situations. The student is expected to: SE TEKS Question Stems The student uses symbols to represent unknowns (20) Given a function describing a situation, determine what A.3A and variables. is represented by each variable in the situation. Given situations, the student looks for patterns and (43) Given the first six numbers in a pattern, determine a A.3B represents generalizations algebraically. expression that can be used to find nth number in the pattern. Foundations for functions. The student understands the importance of the skills required to manipulate symbols in order to solve problems and uses the necessary algebraic skills required to simplify algebraic expressions and solve equations and inequalities in problem situations. The student is expected to: SE TEKS Question Stems The student finds specific function values, (6) What are the dimensions of a rectangle in centimeters if A.4A simplifies polynomial expressions, transforms and the perimeter is 42 centimeters, the length is represented by solves equations, and factors as necessary in (x + 4), and the width is represented by (2x – 7)? problem situations. (22) Determine an equality that is equivalent to 7x – 2y > 8. (23) Factor the polynomial -6x2 – 11x -4 and record as the product of two binomials. The student uses the commutative, associative, and distributive properties to simplify algebraic expressions. (9) Using the commutative, associative, and distributive properties, simplify the expression 0.5(-12c + 6) – 3(c + 4) + 10(c – 5), showing each step of the simplification. The student connects equation notation with (20) Find the value of y when x = -7, given the functions y = A.4C function notation, such as y = x + 1 and f(x) = x + 1 w(x), w(9) = -7 and w(-7) = 9. Linear functions. The student understands that linear functions can be represented in different ways and translates among their various representations. The student is expected to: SE TEKS Question Stems A.4B A.5A A.5B A.5C The student determines whether or not given situations can be represented by linear functions. The student determines the domain and range for linear functions in given situations. The student uses, translates, and makes connections among algebraic, tabular, graphical, or verbal descriptions of linear functions. 𝑐 (39) Determine the range of the function f(c) = when f(c) 20 represents the number of ferry trips needed to transport c cars in one day if there are no more than 5,000 cars transported daily by the ferryboat. (7) Given a graph of a linear equation, determine possible equations that would be represented by the graph. (21) Choose a scatterplot that represents the total late fee for 3 overdue books that were checked out on the same day, if the late fee for overdue books is $0.25 per day per book, with a maximum late fee of $5.00. (49) Determine a set of ordered pairs that are found only on the graph of the function of y = 12 – 3x. Algebra I STAAR EOC 2013 Linear functions. The student understands the meaning of the slope and intercepts of the graphs of linear functions and zeros of linear functions and interprets and describes the effects of changes in parameters of linear functions in real-world and mathematical situations. The student is expected to: SE TEKS Question Stems A.6A A.6B The student develops the concept of slope as rate of change and determines slopes from graphs, tables, and algebraic representations. The student interprets the meaning of slope and intercepts in situations using data, symbolic representations, or graphs. A.6C The student investigates, describes, and predicts the effects of changes in m and b on the graph of y = mx + b A.6D The student graphs and writes equations of lines given characteristics such as two points, a point and a slope, or a slope and y-intercept. A.6E A.6F A.6G The student determines the intercepts of the graphs of linear functions and zeros of linear functions from graphs, tables, and algebraic representations. The student interprets and predicts the effects of changing slope and y-intercept in applied situations. The student relates direct variation to linear functions and solves problems involving proportional change. (5) Describe the meaning of the slope of a given graph that shows the relationship between the number of dollars a worker earns and the number of hours worked by the individual. (47) Identify which given statements are true, based on data provided in tabular form. (17) Determine the changes that were made to the graph of a function f to make the graph of the function g. 1 (33) If a line p is described by the function y = 5 x – 1, and the slope of line p is multiplied by -10 to create line r, determine which given statements describe the relationship between the two lines. (54) Determine a function that describes the new graph if the graph of y = 9x + 4 is translated 4 units up. (30) If a line passes through the point (1, 24) and has a slope of -0.6, determine the equation of the line and state the equation in standard form. (27) Given the graph of a linear function that passes through point (0, 5) and (2, -5), what is the zero of the function? (14) Students are ordering 20 boxes of hats to sell, along with hats left from last year, as a fund raiser. How many fewer hats will the students have to sell if the function describing the number of hats available for sale changes from f(x) = 48x + 37 to h(x) = 24x + 37? (24) Make statements that will describe the change in an airplane’s descent for landing if the plane’s required rate of descent changes from f(x) = -300x + 30,000 to g(x) = -300x + 30,500, where x represents the horizontal distance in miles from where the plane begins its descent. (44) Given a graph representing water level in a tank being drained at a constant rate, determine the change in drainage time if the initial water level stays the same, but the rate at which the tank is drained changes to 3 inches per hour. (10) Given a linear function where y varies directly with x, 20 write a function relating y and x when y = 3 when x = 30. Linear functions. The student formulates equations and inequalities based on linear functions, uses a variety of Algebra I STAAR EOC 2013 methods to solve them, and analyzes the solutions in terms of the situation. The student is expected to: SE TEKS Question Stems The student analyzes situations involving linear (45) Write a function that can be used to find the total A.7A functions and formulates linear equations or height in meters of a building, which includes a rooftop FM inequalities to solve problems. tower that is 15.85 meters tall and has n floors that are each 3.9 meters high. The student investigates methods for solving linear (16) If a painter charges $950 to paint a house, which A.7B equations and inequalities using concrete models, includes an hourly charge of $35 and a $40 fee for renting a graphs, and the properties of equality, selects a ladder, how many hours did the painter spend painting the method, and solves the equations and inequalities. house? (31) Find a coordinate pair that is the solution set for the inequality y < 1 – 6x. - 4 (32) Given the equation y = 5 x – 2, find the value of x when y = -9. For given contexts, the student interprets and (37) Calculate a reasonable number of additional weeks A.7C determines the reasonableness of solutions to needed for a city to reach its average annual rainfall of 33.2 linear equations and inequalities. inches if 9.7 inches have fallen in the first 30 weeks and an expectation of 1.5 inches to 2.1 inches per week is expected through the end of the year. Linear functions. The student formulates systems of linear equations from problem situations, uses a variety of methods to solve them, and analyzes the solutions in terms of the situation. The student is expected to: SE TEKS Question Stems The student analyzes situations and formulates (12) Formulate a system of equations that can be used to A.8A systems of linear equations to solve problems. determine x, the number of 1-inch-thick books and y, the number of 2-inch-thick books if 9 of these books stacked together have a height of 14 inches. The student solves systems of linear equations (3) If a system of equations has no solution, which of the A.8B using concrete models, graph, tables, and algebraic provided graphs best represents that situation? methods. (26) Find the value of x in the solution to a given system of equations. (40) Determine the number of cupcakes sold by a high school band if the number of cupcakes was four more than twice the number of cookies sold, and the band sold 52 cupcakes and cookies. The student interprets and determines the (23) Determine the reasonableness of the decision of a class A.8C reasonableness of solutions to systems of linear to order 72 additional large T-shirts and 144 additional equations. medium T-shirts for a field day if the class need 216 shirts and the number of medium shirts needed is three times the number of large shirts needed. Quadratic and other nonlinear functions. The student understands that the graphs of quadratic functions are affected by the parameters of the function and can interpret and describe the effects of changes in the parameters of Algebra I STAAR EOC 2013 quadratic functions. The student is expected to: SE TEKS A.9A A.9B A.9C A.9D The student determines the domain and range for quadratic functions in given situations. The student investigates, describes, and predicts the effects of changes in a on the graph of y = ax² + c. The student investigates, describes, and predicts the effects of changes in c on the graph of y = ax² + c. The student analyzes graphs of quadratic functions and draws conclusions. Question Stems (19) Describe the change in the graph of y = 3x2 – 2 if the coefficient of x2 is changed from 3 to another positive number. (2) Determine the coordinates of the vertex of the graph of f(x) = x2 + 6x + 10. (41) Given points (0, -5) and (-6, -5) on the graph of a quadratic function, write an equation for the axis of symmetry of the graph of the function. Quadratic and other nonlinear functions. The student understands there is more than one way to solve a quadratic equation and solves them using appropriate methods. The student is expected to: SE TEKS Question Stems The student solves quadratic equations using (15) Write the solution set for the quadratic equation x2 – 16 A.10A concrete models, tables, graphs, and algebraic = 0. methods. (28) Given the graph of the equation y = x2 + x – 6, determine the values of x when x2 + x – 6 = -4. (34) From a table of values for a quadratic function, determine the solution to f(x) = 0 if one solution is 3. The student makes connections among the (46) Find the x-intercepts of the graph of the quadratic A.10B solutions (roots) of quadratic equations, the zeros function f(x) = 5x2 + x – 1 of their related functions, and the horizontal intercepts (x-intercepts) of the graph of the function. Quadratic and other nonlinear functions. The student understands there are situations modeled by functions that are neither linear nor quadratic and models the situations. The student is expected to: SE TEKS Question Stems The student uses patterns to generate the laws of (51) Simplify a given variable expression that includes A.11A exponents and applies them in problem-solving exponents. A.11B A.11C situations. The student analyzes data and represents situations involving inverse variation using concrete models, tables, graphs, or algebraic methods. The student analyzes data and represents situations involving exponential growth and decay using concrete models, tables, graphs, or algebraic methods. (11)) From the provided table of values form an exponential function f, choose a situation that could describe the function.

