Text II, 1-9
advertisement

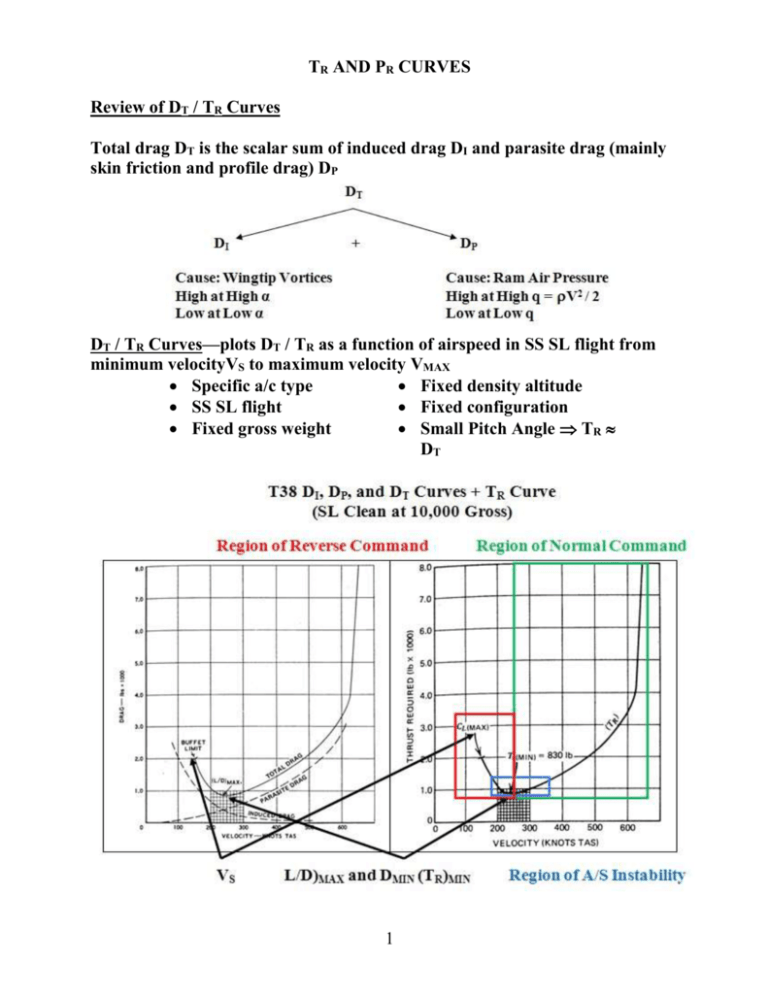
TR AND PR CURVES Review of DT / TR Curves Total drag DT is the scalar sum of induced drag DI and parasite drag (mainly skin friction and profile drag) DP DT / TR Curves—plots DT / TR as a function of airspeed in SS SL flight from minimum velocityVS to maximum velocity VMAX Specific a/c type Fixed density altitude SS SL flight Fixed configuration Fixed gross weight Small Pitch Angle TR DT 1 Relationship between TR and PR Curves (See Figure Next Page) Both curves reflect the performance of the same airplane. TR curve plots thrust in # on y-axis PR curve plots horsepower on y-axis Relationship between the two curves lies in the relationship between thrust and horsepower One horsepower is 550 ft-# / second of work or 550 (60) = 33,000 ft#/minute of work (because a minute has 60 seconds) Relationship between thrust and power required is given by P = T V, where T is thrust in pounds (#), V is aircraft velocity in feet/sec, and P is power in ft-#/sec of work. Note: by this definition, an airplane on the runway for takeoff at full thrust before releasing brakes is developing no power, because V = 0. Forms of the equation: P = T V with P in ft-#/sec. P = T V /550 with P in horsepower (HP) with V in ft/sec (1 HP = 550 ft#/second of work) P = T V / 325.9, with V in nm/hr and P in HP (derivation in Textbook) Thus T = 325.9 P / V, V in nm/hr and P in HP. It follows that if (V, T) is any point on the TR curve, (V, T V / 325.9) is the corresponding point on the PR curve. (V, P) is any point on the PR curve, (V, 325.9 P / V) is the corresponding point on the TR curve. This relationship is shown in the graphic on the next page for three points on the TR curve transformed into corresponding points on the PR curve. Facts & Assumptions about Fuel Flow (FF) Thrust producer = jet powered airplane Power Producer = normally aspirated piston/propeller powered airplane For thrust producer, assume FF TR. For a power producer, assume FF PR. FF important in A/C performance: o VBR (best range airspeed)—maximize V/FF ratio. o VBE (best endurance airspeed)—minimize FF. 2 Points on TR Curve (100, 1800) (160, 1250) (250, 1800) Corresponding Points on PR Curve (100, 1800 (100) / 325.9) = (100, 552) (160, 1250 (160) / 325.9) = (160, 614) (250, 1800 (250) / 325.9) = (250, 1381) Note that the point corresponding to (L/D)MAX on the TR curve lies at the point on the PR curve intersected by a line drawn from the origin tangent to the curve (yellow line). We will see later why this correspondence exists. 3 Interpreting the Curves for Thrust Producers (Assumption: FF TR) On TR Curve Low point is (TR)MIN FFMIN and corresponds to VBE for a thrust producer Consider the point where tangent line from origin intersects the curve: o Slope of this line is (TR/V)MIN (V/TR)MAX (V/FF)MAX, since FF TR. o Since (V/FF)MAX is the definition of best range, this point corresponds to VBR for a thrust producer. On PR Curve Consider the point where tangent line from origin intersects curve: Slope of this line is (PR/V)MIN = (TRV/V)MIN = (TR)MIN , since P = TV. Thus this point on the PR curve corresponds to o the (TR)MIN and (L/D)MAX point on the TR curve o VBE for a thrust producer, since (TR)MIN FFMIN 4 Interpreting the Curves for Power Producers (Assumption: FF PR) On PR Curve Low point is (PR)MIN FFMIN and corresponds to VBE for a power producer Consider the point where tangent line from origin intersects curve: o Slope of this line is (PR/V)MIN (V/PR)MAX (V/FF)MAX, since FF PR. o Since (V/FF)MAX is the definition of best range, this point corresponds to VBR for a power producer. On TR Curve, the low point corresponds to: the point on the PR curve intersected by the tangent line from the origin. Thus this point corresponds to VBR for a power producer. Note: each point correspond to (L/D)MAX on its respective curve. 5 Observations A thrust producer (jet) gets best endurance at (L/DMAX airspeed. A power producer (normally aspirated recip/prop) gets best range at (L/D)MAX airspeed. From the TR curve, one can find o VBR and VBE for a thrust producer. o VBR (but not VBE) for a power producer. From the PR curve, one can find o VBR and VBE for a power producer. o VBE (but not VBR) for a thrust producer. Summary Graphic: provides a succinct summary of key points about interpreting the TR and PR curves for thrust producers and power producers. 6


