EMF-33 Bioenergy Study – Pilot Phase Scenario Protocol
DRAFT
EMF-33 Bioenergy Study – Pilot Phase Scenario Protocol
September 19, 2014
Overview
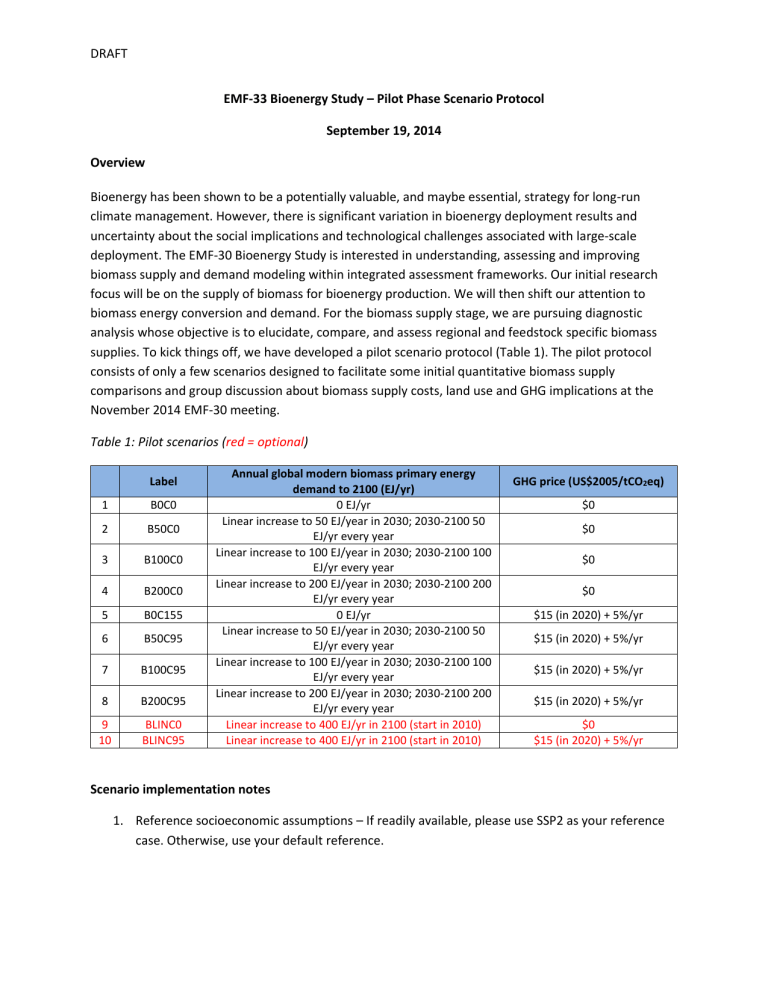
Bioenergy has been shown to be a potentially valuable, and maybe essential, strategy for long-run climate management. However, there is significant variation in bioenergy deployment results and uncertainty about the social implications and technological challenges associated with large-scale deployment. The EMF-30 Bioenergy Study is interested in understanding, assessing and improving biomass supply and demand modeling within integrated assessment frameworks. Our initial research focus will be on the supply of biomass for bioenergy production. We will then shift our attention to biomass energy conversion and demand. For the biomass supply stage, we are pursuing diagnostic analysis whose objective is to elucidate, compare, and assess regional and feedstock specific biomass supplies. To kick things off, we have developed a pilot scenario protocol (Table 1). The pilot protocol consists of only a few scenarios designed to facilitate some initial quantitative biomass supply comparisons and group discussion about biomass supply costs, land use and GHG implications at the
November 2014 EMF-30 meeting.
Table 1: Pilot scenarios ( red = optional )
3
8
9
10
4
5
6
1
2
7
Label
B0C0
B50C0
B100C0
B200C0
B0C155
B50C95
B100C95
B200C95
BLINC0
BLINC95
Annual global modern biomass primary energy demand to 2100 (EJ/yr)
0 EJ/yr
Linear increase to 50 EJ/year in 2030; 2030-2100 50
EJ/yr every year
Linear increase to 100 EJ/year in 2030; 2030-2100 100
EJ/yr every year
Linear increase to 200 EJ/year in 2030; 2030-2100 200
EJ/yr every year
0 EJ/yr
Linear increase to 50 EJ/year in 2030; 2030-2100 50
EJ/yr every year
Linear increase to 100 EJ/year in 2030; 2030-2100 100
EJ/yr every year
Linear increase to 200 EJ/year in 2030; 2030-2100 200
EJ/yr every year
Linear increase to 400 EJ/yr in 2100 (start in 2010)
Linear increase to 400 EJ/yr in 2100 (start in 2010)
GHG price (US$2005/tCO
2 eq)
$0
$0
$0
$0
$15 (in 2020) + 5%/yr
$15 (in 2020) + 5%/yr
$15 (in 2020) + 5%/yr
$15 (in 2020) + 5%/yr
$0
$15 (in 2020) + 5%/yr
Scenario implementation notes
1.
Reference socioeconomic assumptions – If readily available, please use SSP2 as your reference case. Otherwise, use your default reference.
DRAFT
2.
Modern bioenergy – 1 st and 2 nd generation non-traditional bioenergy feedstocks native to your model, where “native” means the current bioenergy feedstocks represented in your model as they are represented. This could include corn, sugarcane, soybeans, energy crops (woody and herbaceous), logs, and/or residue feedstocks (ag, forest, MSW). Traditional bioenergy should
NOT be counted against the annual modern bioenergy demand requirements in the scenarios defined in Table 1. Also, please be sure to turn-off all additional elements of bioenergy demand in your model that might influence land use and land emissions results (e.g., bioenergy technology specifications and penetration constraints, energy price feedbacks to land use).
3.
GHG price scenarios – The GHG price should be applied to ALL default mitigation technologies and greenhouse gases (CO
2
and non-CO
2
), including all default land-based mitigation activities within your model (e.g., existing terrestrial carbon stocks, afforestation, agricultural non-CO
2
).
4.
Start years – Bioenergy demand should grow off of 2010, and carbon pricing should begin the first time step after 2010. Thus, 2010 and earlier are your model default bioenergy levels with a zero carbon price, and the first time step beyond 2010 in your model should reflect the Table 1 bioenergy demand scenario level and carbon price ($0 or $15 (in 2020) rising 5% per year).
Specific values for 2000 to 2100 are shown below in Table 2. Note that the carbon price should start in 2015 at $11.75/tCO
2
if that is your first model year beyond 2010. The carbon price in
2020 should be $15.00/tCO
2
in all models.
Table 2: Modern biomass primary demand and carbon price levels (optional scenarios excluded)
B0 B50 B100 B200 C155
Year EJ/yr EJ/yr EJ/yr EJ/yr US$2005/tCO
2
2000 $0.00
2005 $0.00
Model default
2010 $0.00
2015 0 $11.75
2020 0 Linear increase from
2010 default to 2030 value
$15.00
2025 0 $19.14
2030 0 50 100 200 $24.43
2035 0 50 100 200 $31.18
2040 0 50 100 200 $39.80
2045 0 50 100 200 $50.80
2050 0 50 100 200 $64.83
DRAFT
2055 0
2060 0
2065 0
2070 0
2075 0
2080 0
2085 0
2090 0
2095 0
2100 0
50
50
50
50
50
50
50
50
50
50
100
100
100
100
100
100
100
100
100
100
200
200
200
200
200
200
200
200
200
200
$82.74
$105.60
$134.78
$172.01
$219.53
$280.19
$357.60
$456.40
$582.49
$743.42
Schedule
October 24, 2014 – Pilot scenario results due. Guidance on how to submit results forthcoming.
November 19-21 – EMF30 Meeting
Reporting variables
Resolution: 2000 – 2100, 5 or 10-year time steps (as suits your model), world totals, native model regions (for now), and RCP regions (if already set-up for this aggregation)
Variables:
1.
Bioenergy quantities i.
Total bioenergy primary energy (EJ/yr) ii.
Bioenergy primary energy by bioenergy feedstock categories native to model
(EJ/yr) iii.
Native bioenergy feedstock category definitions
2.
Bioenergy prices i.
Shadow price (native units) ii.
Average feedstock cost (native units)
3.
Agricultural production i.
Agricultural Production (million t DM/yr) ii.
Agricultural Production|Livestock (million t DM/yr) iii.
Agricultural Production|Non-Energy Crops (million t DM/yr) iv.
Agricultural Production|Energy Crops (million t DM/yr)
4.
Crop prices i.
Corn (native units)
DRAFT ii.
Wheat (native units) iii.
Soybean (native units) iv.
Composite (native units)
5.
Emissions
1.
Land CO
2
(Mt CO
2
/yr)
2.
Land CH
4
(Mt CH
4
/yr)
3.
Land N
2
O (kt N
2
O/yr)
6.
Land use
1.
Acreage by land cover categories native to model (million ha/yr)
2.
Native land cover category definitions
