Figures_CDeng_densityfluctuations
advertisement

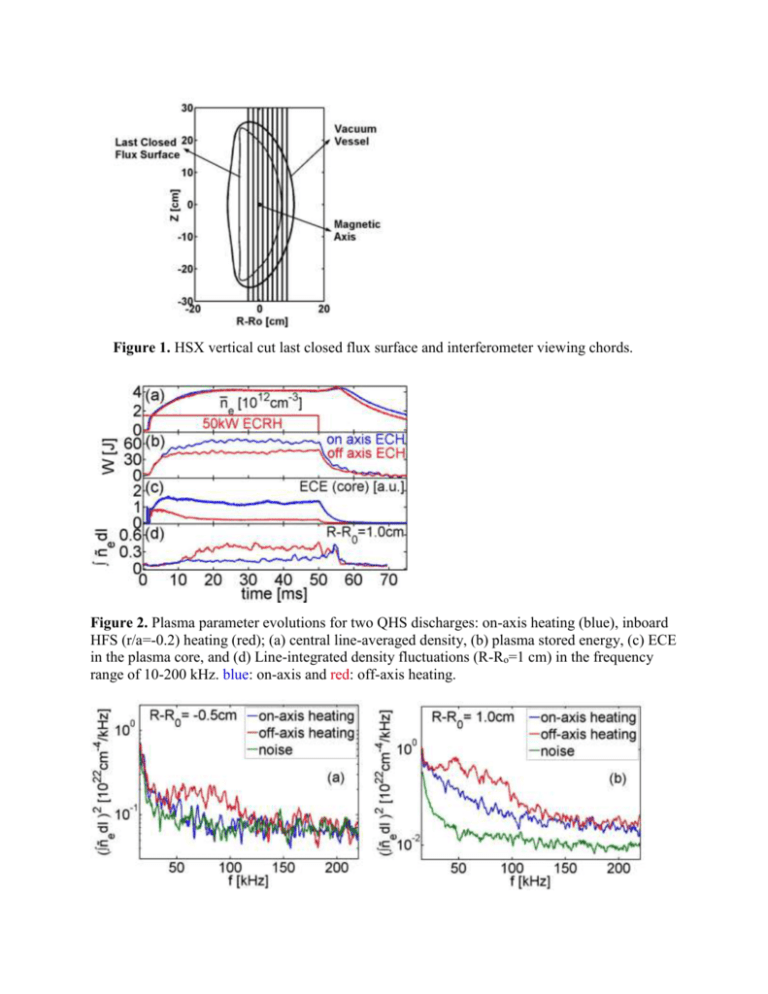
Figure 1. HSX vertical cut last closed flux surface and interferometer viewing chords. Figure 2. Plasma parameter evolutions for two QHS discharges: on-axis heating (blue), inboard HFS (r/a=-0.2) heating (red); (a) central line-averaged density, (b) plasma stored energy, (c) ECE in the plasma core, and (d) Line-integrated density fluctuations (R-Ro=1 cm) in the frequency range of 10-200 kHz. blue: on-axis and red: off-axis heating. Figure 3. Frequency spectra of line-integrated density for different viewing chords. On-axis heating (blue) and HFS inboard heating (red). System noise level corresponds to the green trace. Figure 4. Line-integrated profile of density fluctuation amplitude in the 20-120 kHz frequency range for QHS plasma with on-axis (blue) and HFS heating (red). Figure 5. Frequency spectra of line-integrated density gradient fluctuations measured by differential interferometry. On-axis heating (blue) and HFS inboard heating (red). System noise level corresponds to the green trace. Figure 6. (a) Thomson scattering measurement of electron temperature, and (b) interferometric measurement electron density profiles in HSX. On-axis heating (blue) and HFS heating (red). Figure 7. Core density gradient fluctuations at different electron temperatures, for plasmas heated at (a) magnetic axis, and (b) high field side for different ECRH power and fueling gases; (c) and (d) are density profiles for cases in (a) and (b). System noise level corresponds to the green trace. Figure 8. Normalized density fluctuations for central chord versus normalized inverse electron density gradient at positions (a) r/a=0.3 and (b) r/a=0.5, and (c) versus normalized inverse electron temperature at r/a=0.3. Symbols: open circle: 50kW on-axis ECH, H2 fueling, open triangle: 50kW on-axis ECH, CH4 fueling, open diamond 100kW on-axis ECH, H2 fueling, open square: 100kW on-axis ECH, CH4 fueling. Solid (red) symbols are for similar conditions to corresponding open (blue) symbols except heating is off-axis (HFS). Figure 9. (a) Scaling of plasma stored energy with normalized density fluctuations for central chord. (b) Energy confinement time scaling with normalized density fluctuations from central chord. (c) Ratio of total particle number (N) to intensity of H emission (IH) changes with normalized density fluctuations from central chord. Ratio is proportional to the global particle confinement time. Symbols: open circle: 50kW on-axis ECH, H2 fueling, open triangle: 50kW on-axis ECH, CH4 fueling, open diamond 100kW on-axis ECH, H2 fueling, open square: 100kW Figure 10. Plasma flow parallel to direction of symmetry measured by CHERS for 50kW with two heating locations: on-axis heating (blue) and HFS heating (green); and 100kW on-axis heating (red) for plasma with helical symmetry. [15]


