Contents, Acknowledgements, Abstract
advertisement
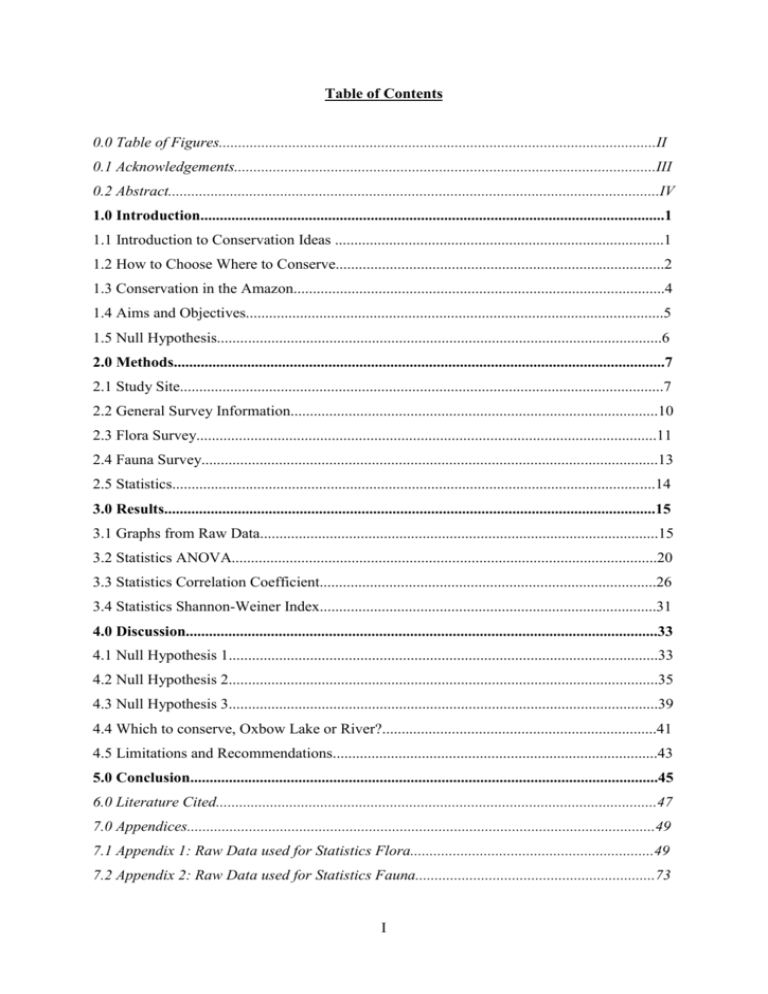
Table of Contents 0.0 Table of Figures.................................................................................................................II 0.1 Acknowledgements.............................................................................................................III 0.2 Abstract...............................................................................................................................IV 1.0 Introduction........................................................................................................................1 1.1 Introduction to Conservation Ideas .....................................................................................1 1.2 How to Choose Where to Conserve.....................................................................................2 1.3 Conservation in the Amazon................................................................................................4 1.4 Aims and Objectives............................................................................................................5 1.5 Null Hypothesis...................................................................................................................6 2.0 Methods...............................................................................................................................7 2.1 Study Site.............................................................................................................................7 2.2 General Survey Information...............................................................................................10 2.3 Flora Survey.......................................................................................................................11 2.4 Fauna Survey......................................................................................................................13 2.5 Statistics.............................................................................................................................14 3.0 Results...............................................................................................................................15 3.1 Graphs from Raw Data.......................................................................................................15 3.2 Statistics ANOVA..............................................................................................................20 3.3 Statistics Correlation Coefficient.......................................................................................26 3.4 Statistics Shannon-Weiner Index.......................................................................................31 4.0 Discussion..........................................................................................................................33 4.1 Null Hypothesis 1...............................................................................................................33 4.2 Null Hypothesis 2...............................................................................................................35 4.3 Null Hypothesis 3...............................................................................................................39 4.4 Which to conserve, Oxbow Lake or River?.......................................................................41 4.5 Limitations and Recommendations....................................................................................43 5.0 Conclusion.........................................................................................................................45 6.0 Literature Cited..................................................................................................................47 7.0 Appendices.........................................................................................................................49 7.1 Appendix 1: Raw Data used for Statistics Flora...............................................................49 7.2 Appendix 2: Raw Data used for Statistics Fauna..............................................................73 I Table of Figures Figure 1: Map of Pacaya-Samiria...............................................................................................9 Figure 2: Map of Study Site Transects.....................................................................................10 Figure 3: Total numbers of species present for each of the four transect sites, with an additional total for the two sites as a whole.............................................................................16 Figure 4: Total numbers of species recorded for all transects..................................................17 Figure 5: Total frequency of each species of flora surveyed at each transect site...................18 Figure 6: Total frequency of each species of fauna surveyed at each transect........................19 Figure 7: Graph showing the mean number of flora species at each of the four sites.............21 Figure 8: Table showing the ANOVA results of flora species at each of the four sites..........21 Figure 9: Table showing the Tukey Test of flora species at each of the four sites..................22 Figure 10: Graph showing the mean number of fauna species at each of the four sites..........23 Figure 11: Table showing the ANOVA results of fauna species at each of the four sites.......23 Figure 12: Graph showing the mean frequency of flora species at each of the four sites........24 Figure 13: Table showing the ANOVA results of flora frequency at each of the four sites....24 Figure 14: Graph showing the mean frequency of fauna species at each of the four sites......25 Figure 15: Table showing the ANOVA results of fauna frequency at each of the four sites...25 Figure 16: Graph showing correlation between flora and fauna species at the lake................27 Figure 17: Table showing the correlation coefficient of figure 16...........................................27 Figure 18: Graph showing correlation between flora and fauna species at the river...............28 Figure 19: Table showing the correlation coefficient of figure 18...........................................28 Figure 20: Graph showing correlation between flora and fauna frequencies at the lake.........29 Figure 21: Table showing the correlation coefficient of figure 20..........................................29 Figure 22: Graph showing correlation between flora and fauna frequencies at the river........30 Figure 23: Table showing the correlation coefficient of figure 22...........................................30 Figure 24: Table of Shannon-Weiner results...........................................................................32 II Acknowledgements Firstly I would like to thank everyone involved with DICE and the Bachelors programmes, the lecturers, researchers and staff. Without their support, guidance and knowledge over the past three years none of this work would have been possible. I particularly would like to thank Dr. Jim Groombridge my project supervisor and Dr. Peter Bennett our fellow Amazonian explorer. Many thanks go to the Amazon crew of 2009, to Santiago for his knowledge of the Amazonian flora and fauna species, and for not getting us lost in the jungle! To the cooks who kept me well fed, to Dr. Richard Bodmer who organised the whole trip, and to Natalie Swan who translated for me in the hospital when I was admitted. My thanks go to my family, particularly my Dad, Mum, and Grandad, who have supported every decision I have made with enthusiasm and pride. These three have journeyed with me all through my life and degree, constantly reminding me to believe in myself and to always try my best, and for this I thank them from the bottom of my heart, for without them I wouldn’t have made it to where I am today. To my late Nan who taught me that education is everything, who always encouraged me to follow my heart and to live life to the full, disregarding any regrets and just doing it better next time! I would like to thank my boyfriend Ben, who has persevered through many a bad mood whilst completing this thesis and degree. For all of his well timed encouragement when I thought I wouldn’t make it, and for his constant belief that hard work pays off in the end. Without his patience and love, insanity would have set in many months ago. My final thanks go to the ‘Lobo Lobo’ explorers, my cabin mates Faye and Sophie, and to my other course mates Cat and Tiger. All of whom have made the past three years the best journey I have ever had the privilege to embark on. III Abstract Recent publications are concentrating on a shift from species conservation to habitat and ecosystem conservation. Choosing where to conserve is often the source of many a debate, focusing on Conservation International’s hotspot method and alternative complementary methods of selection. Hotspot methods often concentrate on just the biodiversity of an area, where complementary methods can take into account many different factors. The Amazon Rainforest is home to many different habitats, each evolving differently within the ecosystems around them. Two habitats that, at a first glance, seem very similar are a river system and an oxbow lake. However, these habitats are actually far more distinct from each other than it appears. By looking at the flora and fauna of each of the areas, the species numbers and the frequencies, it is possible to analyse the data in relation to habitat differences. Statistical tests were carried out, firstly with ANOVA to prove that there was a significant difference between the flora species of the two sites. Followed by a ShannonWeiner Index to highlight which site would be chosen under hotspot methods. The results of this were that the river site was more diverse and therefore the better of the two sites for conservation. However, observed, biological and historical data of oxbow lake sites within the Amazon, suggests otherwise; stating that oxbow lakes should be a better candidate for conservation efforts, indicating that a hotspots method may not be the best to carry out in such a complex habitat, and that complementary methods may be more sufficient. Previous studies within the area suggest that as the flora becomes more complex more niches become available and therefore attract more fauna, suggesting a linear positive correlation. Correlation Coefficients were carried out to assess the correlativeness of the flora and fauna data to test for this linear relationship. However, the fauna data proved to be inconclusive, yielding unexpected results. It is suggested that the data needs to be carried out under more stringent guidelines to eliminate many of the limitations that are carried within this data set. The results of the coefficient, however, suggested that the relationship was much more complex than originally thought, indicating that the ecosystem and its habitats endured a much more interdependent relationship than expected. It was concluded that the habitats within the Amazon were too complex for simple linear relationships to apply and also for simple methods of classification, such as the hotspots method. This highlights the potential problems for ecosystem conservation, where several complex habitats can survive within kilometres of each other, suggesting that one management system would not be sufficient to deliver successful conservation. IV
