Global Climate Model Projections_key
advertisement

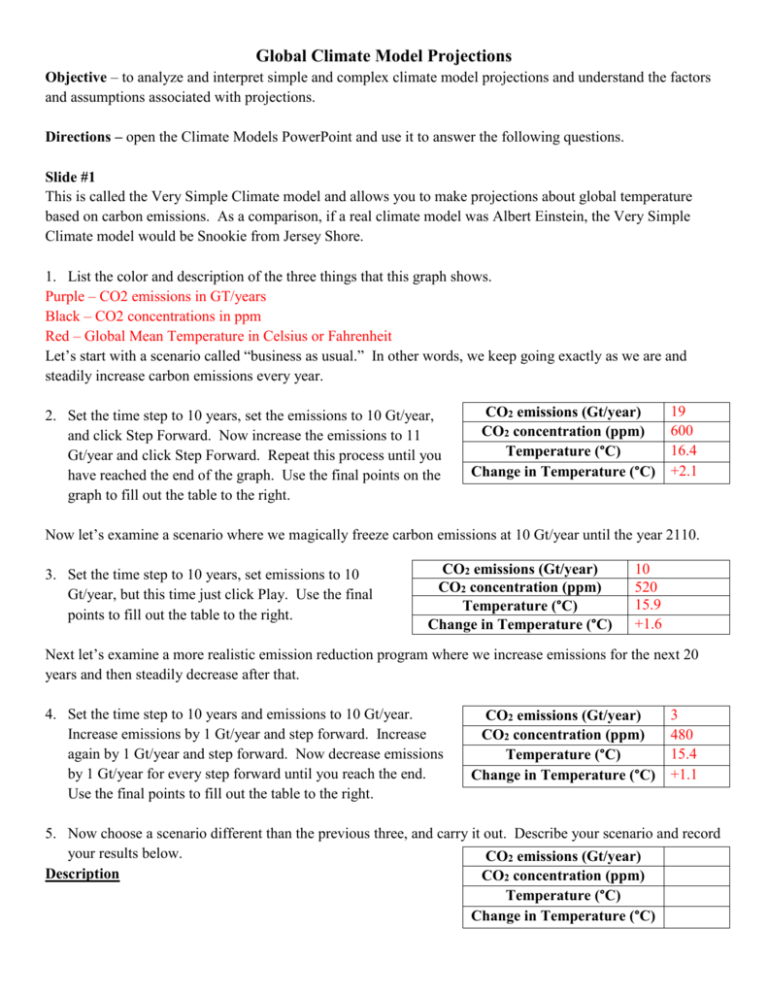
Global Climate Model Projections Objective – to analyze and interpret simple and complex climate model projections and understand the factors and assumptions associated with projections. Directions – open the Climate Models PowerPoint and use it to answer the following questions. Slide #1 This is called the Very Simple Climate model and allows you to make projections about global temperature based on carbon emissions. As a comparison, if a real climate model was Albert Einstein, the Very Simple Climate model would be Snookie from Jersey Shore. 1. List the color and description of the three things that this graph shows. Purple – CO2 emissions in GT/years Black – CO2 concentrations in ppm Red – Global Mean Temperature in Celsius or Fahrenheit Let’s start with a scenario called “business as usual.” In other words, we keep going exactly as we are and steadily increase carbon emissions every year. 2. Set the time step to 10 years, set the emissions to 10 Gt/year, and click Step Forward. Now increase the emissions to 11 Gt/year and click Step Forward. Repeat this process until you have reached the end of the graph. Use the final points on the graph to fill out the table to the right. CO2 emissions (Gt/year) CO2 concentration (ppm) Temperature (°C) Change in Temperature (°C) 19 600 16.4 +2.1 Now let’s examine a scenario where we magically freeze carbon emissions at 10 Gt/year until the year 2110. 3. Set the time step to 10 years, set emissions to 10 Gt/year, but this time just click Play. Use the final points to fill out the table to the right. CO2 emissions (Gt/year) CO2 concentration (ppm) Temperature (°C) Change in Temperature (°C) 10 520 15.9 +1.6 Next let’s examine a more realistic emission reduction program where we increase emissions for the next 20 years and then steadily decrease after that. 4. Set the time step to 10 years and emissions to 10 Gt/year. Increase emissions by 1 Gt/year and step forward. Increase again by 1 Gt/year and step forward. Now decrease emissions by 1 Gt/year for every step forward until you reach the end. Use the final points to fill out the table to the right. CO2 emissions (Gt/year) CO2 concentration (ppm) Temperature (°C) Change in Temperature (°C) 3 480 15.4 +1.1 5. Now choose a scenario different than the previous three, and carry it out. Describe your scenario and record your results below. CO2 emissions (Gt/year) Description CO2 concentration (ppm) Temperature (°C) Change in Temperature (°C) Slide #2 1. What is this graph showing and why is it important? This graph is showing how closely 58 different models match observational data as well as how well the “average” of all those models compares. It’s important because it provides confidence in the ability of climate models to accurately project into the future. Slide #3 This is an interactive display of the actual global climate model projections made by the IPCC. Just like the different scenarios you ran with the Very Simple Climate Model, there are a number of different projections based on population, economic, and energy use factors. In other words, this is the Albert Einstein version… 1. Using the drop down menu in the upper right hand corner, examine each different scenario and use the information to fill out the table below. Scenario Description Factors Result A1B A more homogenous “global” economy and society with rapid increases in technology and an energy policy that is (B)alanced between all sources of energy Population: Low (~7 billion) Economic growth: Very high Primary Energy Use: Very high Land use change: Low CO2 emissions: 13 Gt/year CO2 conc: 680 ppm Temp increase: 3 °C A1F1 Same as A1B but with most energy still coming from fossil fuels. (F)ossil (I)ntensive. Population: Low (~7 billion) Economic growth: Very high Primary Energy Use: Very high Land use change: Low CO2 emissions: 30 Gt/year CO2 conc: 1000 ppm Temp increase: 5 °C A1T Same as A1B but with most energy coming from non fossil fuel sources. Population: Low (~7 billion) Economic growth: Very high Primary Energy Use: Very high Land use change: Low CO2 emissions: 4 Gt/year CO2 conc: 600 ppm Temp increase: 2.5 °C A2 Heterogeneous “non global” economy and society. Population steadily increases. Development is regional. (“Business as usual” scenario) Population: High Economic growth: Medium Primary Energy Use: High Land use change: Medium CO2 emissions: 29 Gt/year CO2 conc: 900 ppm Temp increase: 4 °C B1 Low, more homogenous population with an emphasis on global solutions for sustainable energy and land use changes. (Most countries get their act together) Increasing population with an emphasis on local solutions to economic, social, and energy issues. (Some countries get their act together) Population: Low Economic growth: High Primary Energy Use: Low Land use change: High CO2 emissions: 6 Gt/year CO2 conc: 580 ppm Temp increase: 2 °C Population: Medium Economic growth: Medium Primary Energy Use: Medium Land use change: Medium CO2 emissions: 14 Gt/year CO2 conc: 600 ppm Temp increase: 3 °C B2 2. On a separate piece of paper, summarize what was done in this activity, what the results where, and why it is important to understanding global climate change.


