Unit 7 Study Guide
advertisement
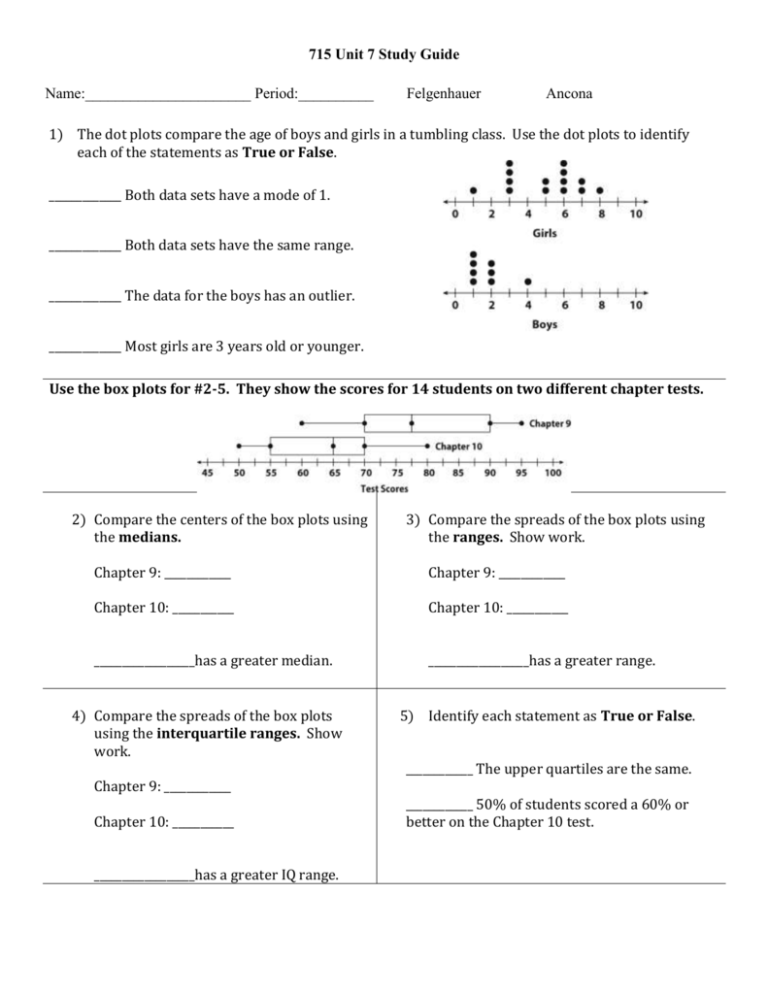
715 Unit 7 Study Guide Name:______________________ Period:__________ Felgenhauer Ancona 1) The dot plots compare the age of boys and girls in a tumbling class. Use the dot plots to identify each of the statements as True or False. _____________ Both data sets have a mode of 1. _____________ Both data sets have the same range. _____________ The data for the boys has an outlier. _____________ Most girls are 3 years old or younger. Use the box plots for #2-5. They show the scores for 14 students on two different chapter tests. 2) Compare the centers of the box plots using the medians. 3) Compare the spreads of the box plots using the ranges. Show work. Chapter 9: ____________ Chapter 9: ____________ Chapter 10: ___________ Chapter 10: ___________ __________________has a greater median. __________________has a greater range. 4) Compare the spreads of the box plots using the interquartile ranges. Show work. Chapter 9: ____________ Chapter 10: ___________ __________________has a greater IQ range. 5) Identify each statement as True or False. ____________ The upper quartiles are the same. ____________ 50% of students scored a 60% or better on the Chapter 10 test. Use the data set for questions #6-11. The data set shows the ages of a random sample of children under 13 who own a hover craft. Children’s Ages 7, 9, 8, 10, 12, 11, 13,13, 12,12 6) Make a dot plot to display the data. 0 5 10 15 Children’s Ages 7) Make a box plot to display the data. Remember your plot should include: the lowest value the highest value the median the lower quartile upper quartile 0 5 8) What is the age range? Show work. 10) What is the interquartile range? Show work. 10 15 9) What is the most common age? 11) For this data set, is a child more or less likely to be younger than 10? Use the information to answer questions #12-13. Statistical measures are shown below for the number of hours per week spent watching television by the students in seventh and eighth grade. Seventh Grade: Mean number of hours spent watching T.V. = 18; (MAD) Mean absolute deviation = 4 Eighth Grade: Mean number of hours spent watching T.V. = 22; (MAD) Mean absolute deviation = 2 12) Find the difference between the means. 13) Complete the statement. Fill in the blank. The difference of the means is __________ times the MAD. Average monthly temperatures (in ˚F) for two cities are shown in the tables below. Use the data for questions #13-17. City 1 85, 81, 85, 68, 82, 84, 83, 81, 77, 79, 69, 80 City 2 75, 77, 79, 95, 90, 88, 88, 87, 85, 82, 75, 77 14) Calculate the mean for City 1 (to the nearest degree). Show work. 15) Calculate the mean for City 2 (to the nearest degree). Show work. 16) What is the difference in the means? Show work. 17) What is the difference of the ranges? Show work. 18) Compare the differences of the means as a multiple of the actual ranges. Show your work. The means of the two data sets differ by about _____________ times the variability (range). 19) Sean and Lauren want to know what fitness equipment people prefer at the gym. They each had different ideas on how to choose their sample. Sean: I can ask the first 50 gym member that enters. Lauren: I can ask 10 people on the treadmills, and Sean can ask 10 people lifting weights. a) Whose sampling method is better? Explain. ______________________________ because ____________________________________________________ _____________________________________________________________________________________________ b) To survey their sample, Lauren poses the question, “Do you like the treadmill best?” Determine whether or not the question is biased. Explain. _________________________________________________________________________________________________ _________________________________________________________________________________________________ _________________________________________________________________________________________________ 20) There are 750 students at Frost Junior High. The results of a random sample of students at the school are shown in the table. Estimate the number of students that prefer each class. ____________ Math _____________ Science ___________ Social Studies Favorite Subjects Math 49 Science Social Studies Language Arts 35 16 30 _________Language Arts 21) In a survey about new park, which group is least likely to be a biased sample? 22) a) randomly chosen gym members Your basketball team wants to get new colors for their jerseys. Which group should you ask to get a random sample of opinions? a) 10 basketball players b) randomly chosen drivers c) randomly chosen shoppers at a mall b) every tenth student who enters the school in the morning d) randomly chosen joggers c) 40 football players d) the people that did not make the team Show work. Label units. In a shipment of 2,000 beach balls, 150 are defective. The beach ball company uses a random sample to simulate 20 beach balls to inspect in the next shipment. The integers 1-150 represent defective beachballs. 23) 43 1702 628 357 14 1432 1915 457 769 1312 85 57 1721 65 9 1441 1663 699 145 1840 Based on this sample, how many defective pens might the manufacturer expect in the next shipment of 2000 pens? 24) Each cell in the table below represents the number of kids in each family. A real estate agent uses a random sample (the shaded numbers) to estimate the average number of kids in each family. Show work and label units. 4 1 3 2 2 3 0 8 2 5 9 3 4 4 5 a) Find the mean of the random sample. b) Use your answer from part a to estimate the total number of kids in the neighborhood. Answer Key: 1) F, F, T, F 2) 77.5, 65, Chapter 9 3) 35, 30, Chapter 9 4) 20, 15, Chapter 9 5) F, F 8) 6 years 10) 3 years 11) Less likely 18) about 1.23 12) 4 15) 83.2° 9) 12 years old 16) 3.7° 21) c 22) b 23) 700 pens 24a) 5.2 24b) 78 kids 17) 3 19a) Sean; Explanations will vary 6) Teacher will show in class 1 13) 2 7) Teacher will show in class 14) 79.5° 19b) Biased; Explanations will vary 20) Math 283 Science 202 SS 92 LA 173


