NYS COMMON CORE MATHEMATICS CURRICULUM
Name
End-of-Module Assessment Task
8•6
Date
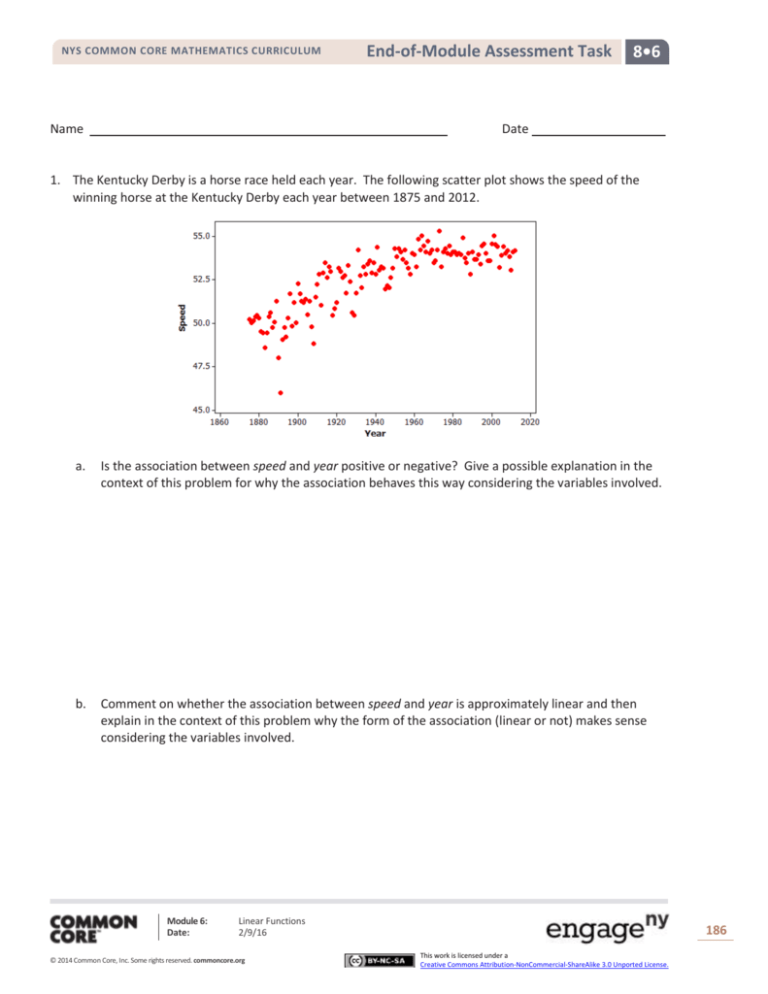
1. The Kentucky Derby is a horse race held each year. The following scatter plot shows the speed of the
winning horse at the Kentucky Derby each year between 1875 and 2012.
a.
Is the association between speed and year positive or negative? Give a possible explanation in the
context of this problem for why the association behaves this way considering the variables involved.
b.
Comment on whether the association between speed and year is approximately linear and then
explain in the context of this problem why the form of the association (linear or not) makes sense
considering the variables involved.
Module 6:
Date:
Linear Functions
2/9/16
© 2014 Common Core, Inc. Some rights reserved. commoncore.org
186
This work is licensed under a
Creative Commons Attribution-NonCommercial-ShareAlike 3.0 Unported License.
NYS COMMON CORE MATHEMATICS CURRICULUM
c.
End-of-Module Assessment Task
8•6
Circle an outlier in this scatter plot and explain, in context, how and why the observation is unusual.
2. Students were asked to report their gender and how many times a day they typically wash their hands.
Of the 738 males, 66 said they wash their hands at most once a day, 583 said two to seven times per day,
and 89 said eight or more times per day. Of the 204 females, 2 said they wash their hands at most once
a day, 160 said two to seven times per day, and 42 said eight or more times per day.
a.
Summarize these data in a two-way table with rows corresponding to the three different frequencyof-hand-washing categories and columns corresponding to gender.
b.
Do these data suggest an association between gender and frequency of hand washing? Support your
answer with appropriate calculations.
Module 6:
Date:
Linear Functions
2/9/16
© 2014 Common Core, Inc. Some rights reserved. commoncore.org
187
This work is licensed under a
Creative Commons Attribution-NonCommercial-ShareAlike 3.0 Unported License.
NYS COMMON CORE MATHEMATICS CURRICULUM
End-of-Module Assessment Task
8•6
3. Basketball players who score a lot of points also tend to be strong in other areas of the game such as
number of rebounds, number of blocks, number of steals, and number of assists. Below are scatter plots
and linear models for professional NBA (National Basketball Association) players last season.
a.
𝑦 = 21.54 + 3.833𝑥
𝑦 = 294.9 + 22.45𝑥
𝑦 = 98.03 + 9.558𝑥
𝑦 = 166.2 + 2.256𝑥
The line that models the association between points scored and number of rebounds is
𝑦 = 21.54 + 3.833𝑥, where 𝑦 = points scored and 𝑥 = number of rebounds. Give an
interpretation, in context, of the slope of this line.
Module 6:
Date:
Linear Functions
2/9/16
© 2014 Common Core, Inc. Some rights reserved. commoncore.org
188
This work is licensed under a
Creative Commons Attribution-NonCommercial-ShareAlike 3.0 Unported License.
NYS COMMON CORE MATHEMATICS CURRICULUM
End-of-Module Assessment Task
8•6
b.
The equations above all show 𝑦 = number of points as a function of the other variables. An increase
in which of the variables (rebounds, blocks, steals, and assists) tends to have the largest impact on
the predicted points scored by an NBA player?
c.
Which of the four linear models shown in the scatter plots above has the worst fit to the data?
Explain how you know using the data above.
Module 6:
Date:
Linear Functions
2/9/16
© 2014 Common Core, Inc. Some rights reserved. commoncore.org
189
This work is licensed under a
Creative Commons Attribution-NonCommercial-ShareAlike 3.0 Unported License.
NYS COMMON CORE MATHEMATICS CURRICULUM
End-of-Module Assessment Task
8•6
A Progression Toward Mastery
Assessment
Task Item
1
a
8.SP.A.1
b
8.F.B.5
c
8.SP.A.2
2
a
8.SP.A.4
STEP 1
Missing or incorrect
answer and little
evidence of
reasoning or
application of
mathematics to
solve the problem.
STEP 2
Missing or incorrect
answer but
evidence of some
reasoning or
application of
mathematics to
solve the problem.
STEP 3
A correct answer
with some
evidence of
reasoning or
application of
mathematics to
solve the problem
OR an incorrect
answer with
substantial
evidence of solid
reasoning or
application of
mathematics to
solve the problem.
STEP 4
A correct answer
supported by
substantial
evidence of solid
reasoning or
application of
mathematics to
solve the problem.
Student does not use
the data in the scatter
plot or context to
answer question.
Student discusses horses
getting faster with
newer training methods
but does not discuss the
data in the scatter plot.
Student discusses the
overall increase of
speeds but does not
discuss how that data
implies horses getting
faster over time.
Student discusses the
overall increase of
speeds and how that
data implies horses
getting faster over time.
Student does not use
the data in the scatter
plot or context to
answer question.
Student does not
recognize the nonlinear
nature of the data.
Student discusses the
nonlinear nature of the
data but does not relate
to the context.
Student discusses the
curvature in the data,
which indicates that
speeds should level off.
Student does not use
the data in the scatter
plot or context to
answer question.
Student picks the year
with the fastest or
lowest speed of the
winning horse and does
not explain choice.
Student picks the year
with the lowest speed of
the winning horse but
does not interpret the
negative residual.
Student picks the year
with the lowest speed of
the winning horse and
states that the speed is
much lower than is
expected for that year.
Student does not use
the data given in the
stem.
Student gives tallies of
the two distributions
separately without
looking at the crosstabulation.
Student constructs the
table but uses gender as
the row variable.
Student constructs a 3 ×
2 two-way table,
including appropriate
labels.
Module 6:
Date:
Linear Functions
2/9/16
© 2014 Common Core, Inc. Some rights reserved. commoncore.org
190
This work is licensed under a
Creative Commons Attribution-NonCommercial-ShareAlike 3.0 Unported License.
NYS COMMON CORE MATHEMATICS CURRICULUM
b
8.SP.A.4
3
a
End-of-Module Assessment Task
Student answer is based
only on context without
references to data.
Student gives some
information about the
association but does not
back it up numerically.
OR
Student says the results
cannot be compared
because the numbers of
males and females are
not equal.
Student attempts to
calculate the six
conditional proportions
but compares them
inappropriately.
OR
Student does not
correctly complete all
the calculations.
Student calculates the
six conditional
proportions, compares
them, and draws an
appropriate comparison
(e.g., 20% of females
wash eight or more
times compared to 12%
of males).
Student cannot identify
the slope from the stem.
Student interprets slope
incorrectly.
Student interprets slope
correctly but not in
context or not in terms
of model estimation.
Student interprets slope
correctly and predicts
that on average, for
each additional
rebound, an increase of
3.833 points is scored.
Student does not relate
to the functions
provided above the
scatter plots.
Student focuses on the
strength of the
association in terms of
how close the dots fall
to the regression line.
Student appears to
relate the question to
the slope of the
equation but cannot
make a clear choice of
which variable has the
largest impact or does
not provide a complete
justification.
Student relates the
question to the slope
and identifies number of
blocks as the variable
with largest impact.
Student does not use
the data in the scatter
plots to answer the
question.
Student focuses only on
the slope of the line or
on one or two values
that are not well
predicted.
Student focuses on the
vertical distances of the
dots from the line but is
not able to make a clear
choice.
Student selects number
of blocks based on the
additional spread of the
dots about the
regression line in that
scatter plot compared to
the other variables.
8.F.B.4
b
8.SP.A.3
c
8.SP.A.2
8•6
Module 6:
Date:
Linear Functions
2/9/16
© 2014 Common Core, Inc. Some rights reserved. commoncore.org
191
This work is licensed under a
Creative Commons Attribution-NonCommercial-ShareAlike 3.0 Unported License.
NYS COMMON CORE MATHEMATICS CURRICULUM
Name
End-of-Module Assessment Task
8•6
Date
1. The Kentucky Derby is a horse race held each year. The following scatter plot shows the speed of the
winning horse at the Kentucky Derby each year between 1875 and 2012.
a.
Is the association between speed and year positive or negative? Give a possible explanation in the
context of this problem for why the association behaves this way considering the variables involved.
b.
Comment on whether the association between speed and year is approximately linear and then
explain in the context of this problem why the form of the association (linear or not) makes sense
considering the variables involved.
Module 6:
Date:
Linear Functions
2/9/16
© 2014 Common Core, Inc. Some rights reserved. commoncore.org
192
This work is licensed under a
Creative Commons Attribution-NonCommercial-ShareAlike 3.0 Unported License.
NYS COMMON CORE MATHEMATICS CURRICULUM
c.
End-of-Module Assessment Task
8•6
Circle an outlier in this scatter plot and explain, in context, how and why the observation is unusual.
2. Students were asked to report their gender and how many times a day they typically wash their hands.
Of the 738 males, 66 said they wash their hands at most once a day, 583 said two to seven times per day,
and 89 said eight or more times per day. Of the 204 females, 2 said they wash their hands at most once
a day, 160 said two to seven times per day, and 42 said eight or more times per day.
a.
Summarize these data in a two-way table with rows corresponding to the three different frequencyof-hand-washing categories and columns corresponding to gender.
b.
Do these data suggest an association between gender and frequency of hand washing? Support your
answer with appropriate calculations.
Module 6:
Date:
Linear Functions
2/9/16
© 2014 Common Core, Inc. Some rights reserved. commoncore.org
193
This work is licensed under a
Creative Commons Attribution-NonCommercial-ShareAlike 3.0 Unported License.
NYS COMMON CORE MATHEMATICS CURRICULUM
End-of-Module Assessment Task
8•6
3. Basketball players who score a lot of points also tend to be strong in other areas of the game such as
number of rebounds, number of blocks, number of steals, and number of assists. Below are scatter plots
and linear models for professional NBA (National Basketball Association) players last season.
a.
𝑦 = 21.54 + 3.833𝑥
𝑦 = 294.9 + 22.45𝑥
𝑦 = 98.03 + 9.558𝑥
𝑦 = 166.2 + 2.256𝑥
The line that models the association between points scored and number of rebounds is
𝑦 = 21.54 + 3.833𝑥, where 𝑦 = points scored and 𝑥 = number of rebounds. Give an
interpretation, in context, of the slope of this line.
Module 6:
Date:
Linear Functions
2/9/16
© 2014 Common Core, Inc. Some rights reserved. commoncore.org
194
This work is licensed under a
Creative Commons Attribution-NonCommercial-ShareAlike 3.0 Unported License.
NYS COMMON CORE MATHEMATICS CURRICULUM
End-of-Module Assessment Task
8•6
b.
The equations above all show 𝑦 = number of points as a function of the other variables. An increase
in which of the variables (rebounds, blocks, steals, and assists) tends to have the largest impact on
the predicted points scored by an NBA player?
c.
Which of the four linear models shown in the scatter plots above has the worst fit to the data?
Explain how you know using the data above..
Module 6:
Date:
Linear Functions
2/9/16
© 2014 Common Core, Inc. Some rights reserved. commoncore.org
195
This work is licensed under a
Creative Commons Attribution-NonCommercial-ShareAlike 3.0 Unported License.

