FRC Summative Assessment KEY
advertisement

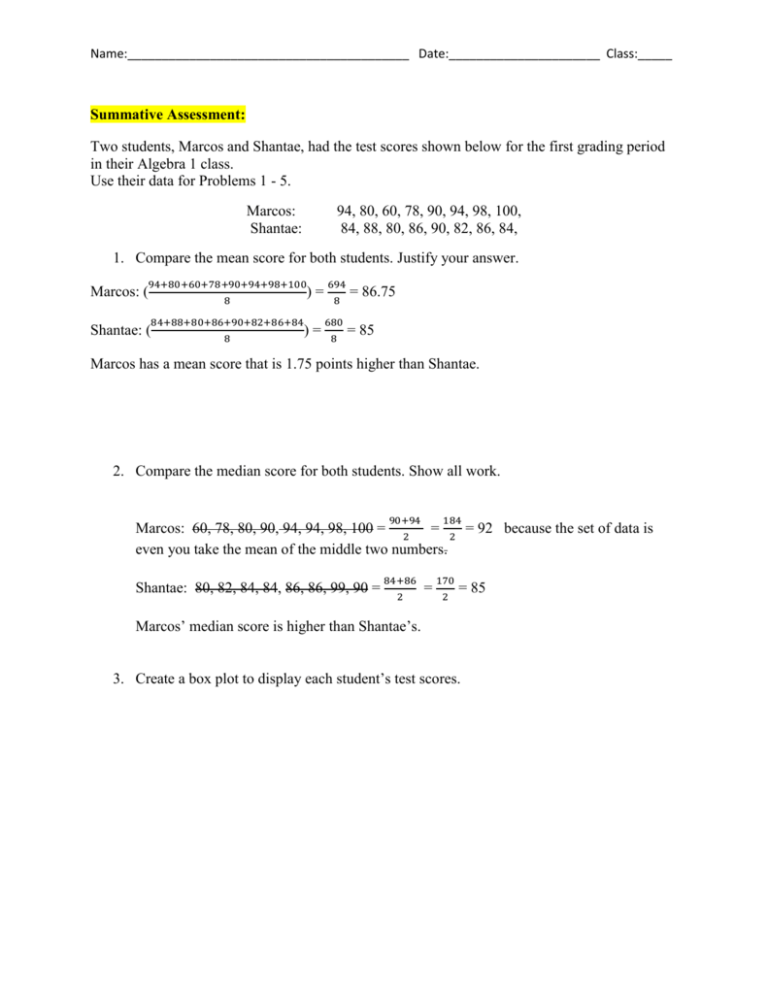
Name:_________________________________________ Date:______________________ Class:_____ Summative Assessment: Two students, Marcos and Shantae, had the test scores shown below for the first grading period in their Algebra 1 class. Use their data for Problems 1 - 5. Marcos: Shantae: 94, 80, 60, 78, 90, 94, 98, 100, 84, 88, 80, 86, 90, 82, 86, 84, 1. Compare the mean score for both students. Justify your answer. Marcos: ( 94+80+60+78+90+94+98+100 694 8 8 Shantae: ( )= 84+88+80+86+90+82+86+84 680 8 8 )= = 86.75 = 85 Marcos has a mean score that is 1.75 points higher than Shantae. 2. Compare the median score for both students. Show all work. 90+94 184 Marcos: 60, 78, 80, 90, 94, 94, 98, 100 = 2 = 2 = 92 because the set of data is even you take the mean of the middle two numbers. Shantae: 80, 82, 84, 84, 86, 86, 99, 90 = 84+86 2 = 170 2 = 85 Marcos’ median score is higher than Shantae’s. 3. Create a box plot to display each student’s test scores. Name:_________________________________________ Date:______________________ Class:_____ 4 Find the interquartile range for both students. Show calculations and answer. a. Marcos: 60, 78, 80, 90, 92 94, 94, 98, 100 Q1 = 78+80 2 = 79 Q3 = 94+98 2 = 96 IQR = 96 -79 = 17 b. Shantae: 80, 82, 83 84, 84, 85 86, 86, 87 88, 90 Q1 = 82+84 2 = 83 Q3 = 86+88 2 = 87 IQR = 87 – 83 = 4 5. Calculate the standard deviation for both students’ data. Show all work. a. Marcos: 86.75 -60 =26.75; 86.75 – 78 = 8.75; 86.75 - 80 = 6.75; 86.75 – 100 = -13.25; Name:_________________________________________ Date:______________________ Class:_____ 86.75- 90= -3.25; 86.75 – 94 = -7.25; 86.75 – 94 = -7.25; 86.75 – 98 = -11.25 Variance = [(26.75)2 + (8.75)2 + (6.75)2 + (-13.25)2 + (-3.25)2 + (-7.25)2 + (-11.25)2 + (-7.25)2] ÷ 8 = 157.01 Standard Deviation = 157.01 = 12.53 (rounded to nearest hundredth) Shantae: 85 -80 =5; 85 – 82 = 3; 85 - 84 = 1; 85 – 84 = 1; 85- 86= -1; 85 – 86 = -1; 85 – 88 = -3; 85 – 90 = -5 Variance = [52 + 32 + 12 + 12 + (-1)2 + (-1)2 + (-3)2 + (-5)2] ÷ 8 = 8.875 Standard Deviation = 8.875 = 2.98 (rounded to nearest hundredth) 6. The following data represent a summary of the grades on a previous Algebra 1 test for a different class consisting of 19 students: minimum = 65, Q1 = 70, median =80, Q3 = 82, maximum = 95. Is there an outlier for this test? Justify your answer Outlier must be 1.5IQR above Q3 or below Q1. IQR = 82 – 70 =12 1.5(12) = 18 Q1 – 18 = 70 -18 = 52 Q3 + 18 = 82 + 18 = 100 The Minimum is 65 and the Maximum is 95 so there are no outliers. Name:_________________________________________ Date:______________________ Class:_____ 7. The results of the class scores are normally distributed. The mean test score is 70. Sixteen percent of the scores are under 60. What would be the value of the standard deviation? Justify your answer. In a normal distribution of data the mean is always in the center so 50 percent of data is above the mean and 50 percent below. Sixty eight percent of the data lies within one Standard Deviation of the mean, 34 percent above and 34 percent below. This implies that beyond one Standard Deviation there is 16 percent of data above and below one Standard Deviation. Given that the mean score is 70 and 16 percent of the scores fall below 60 one can conclude that a score of 60 is one Standard Deviation below the mean. The Standard Deviation is therefore equal to 70 minus 60 which is 10. 8. Graph A has less of a spread indicating that the Spurs scores were more clustered around the median; giving the team a smaller variance as well as a smaller Standard Deviation of scores. Graph B has a wider distribution of scores because the graph has a wider spread so there are more variances and as a result the Heat has a Standard Deviation that is larger than the Spurs.


