Open-Day-July-2012-r.. - University of Bradford
advertisement
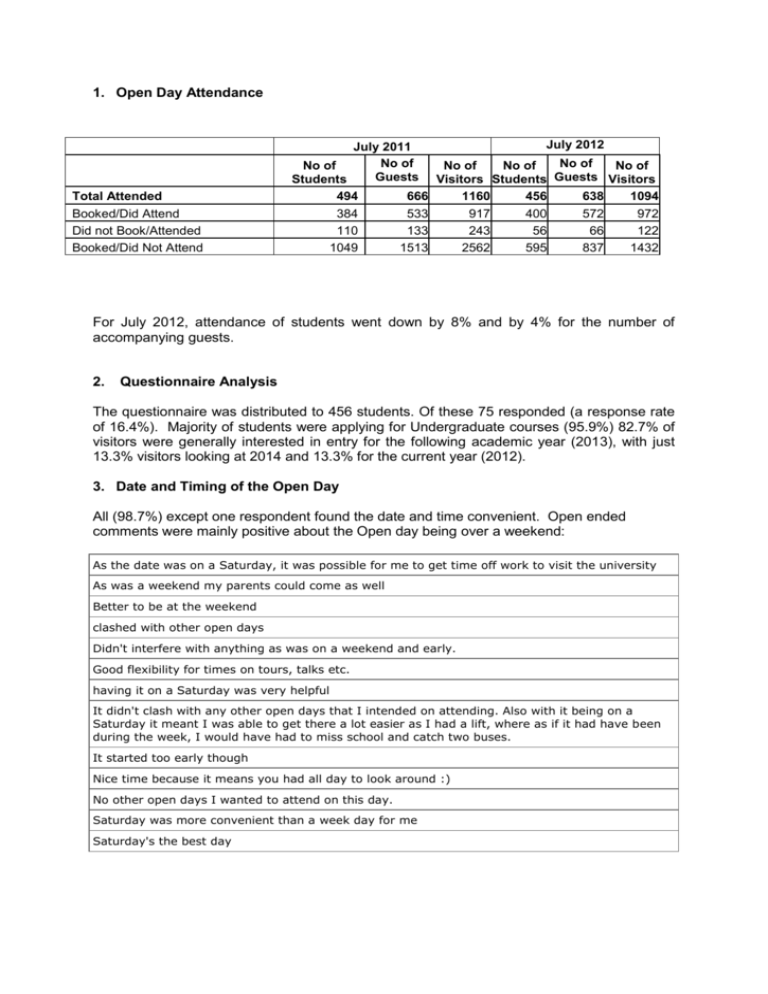
1. Open Day Attendance Total Attended Booked/Did Attend Did not Book/Attended Booked/Did Not Attend July 2012 July 2011 No of No of No of No of No of No of Guests Visitors Students Guests Visitors Students 494 666 1160 456 638 1094 384 533 917 400 572 972 110 133 243 56 66 122 1049 1513 2562 595 837 1432 For July 2012, attendance of students went down by 8% and by 4% for the number of accompanying guests. 2. Questionnaire Analysis The questionnaire was distributed to 456 students. Of these 75 responded (a response rate of 16.4%). Majority of students were applying for Undergraduate courses (95.9%) 82.7% of visitors were generally interested in entry for the following academic year (2013), with just 13.3% visitors looking at 2014 and 13.3% for the current year (2012). 3. Date and Timing of the Open Day All (98.7%) except one respondent found the date and time convenient. Open ended comments were mainly positive about the Open day being over a weekend: As the date was on a Saturday, it was possible for me to get time off work to visit the university As was a weekend my parents could come as well Better to be at the weekend clashed with other open days Didn't interfere with anything as was on a weekend and early. Good flexibility for times on tours, talks etc. having it on a Saturday was very helpful It didn't clash with any other open days that I intended on attending. Also with it being on a Saturday it meant I was able to get there a lot easier as I had a lift, where as if it had have been during the week, I would have had to miss school and catch two buses. It started too early though Nice time because it means you had all day to look around :) No other open days I wanted to attend on this day. Saturday was more convenient than a week day for me Saturday's the best day 92% managed to do everything they wanted to do in the day an improvement on July 2011 where this was 90%. The following reasons were provided nearly all being positive: . evrything was very well spaced out with lots of times for the same event to choose which to go to. Having to walk to between Student Central/ Richmond Building i did'nt manage to get round to everything i wanted due to being temperarly in a wheelchair and i did struggle to keep up with the students that was showing us around. I just had enough time I liked that each department had it's own talk and the accommodation tour I wanted to hear about the finance, go on the campus tour and accomadation tour and hear about my course and was 100% happy with everything I saw from the website It was all set out fine. The online tracker was a very useful and worthwhile tool when it came to managing time and talks etc. the schedule on the internet wasn't cleat whwther it was a talk or tour there was fairly good organization and I was able to see everything I wanted to Very well organised, lots of useful talks Wouldhave liked to do chemical engineering tour, but couldn't fit morning tour in and afternoon tour was at same time as mechanical engineering- may be separate times on offer next time? 98.7% felt that information provided was adequate for the Open Day a 3% rise from July 2011 . The most commonly used booking process was the online Open day web form (58.7%) followed by email (24.0%). All visitors had found the booking process efficient, stating it was simple, easy to book and quick. 4. Getting to the Open Day Visitors and students had mainly travelled by car 71.6% (70.4% in July 2011), the remainder had either used public transport (21.6%) or walked (6.8%). July 2011 October 2011 July 2012 The ease of finding their way to the university and campus was mainly rated positively: Excellent Good Average Poor Very poor Ease of finding University Ease of finding way around campus Ease of finding University Ease of finding way around campus Ease of finding University Ease of finding way around campus 48.0 38.7 12.0 1.3 0 33.3 45.8 12.5 6.9 1.4 (#1) 36.1% 43.4% 16.9% 3.6% 0% 39.8% 48.2% 9.6% 2.4% 0% 35.2% 39.4% 18.3% 2.8% 4.2% 44.9% 44.9% 8.7% 1.4% 0% 5. How Visitors rated the Open Day: July 2012 (%) October 2011 (%) Very Very Very Good Average Poor good Poor good Friendliness/ Helpfulness of staff 54.7 38.7 4.0 0 Good Average Poor Very Poor Very good Good Average Poor Very Poor 69 27 5 0 0 68 26 5 0 0 66 28 6 0 0 66 27 9 0 0 48 38 8 6 0 48 41 9 2 0 57 39 4 0 0 64 32 4 0 0 51 24 16 7 2 56 21 18 5 0 65 29 6 0 0 64 29 7 0 0 2.7 Friendliness/Helpfulness of Students Welcome Talk 36 36 21 3 3 Making a good UCAS application Talk 50 42 0 8 0 Campus Tour 43 40 3 9 6 Department Tour July 2011 (%) This question was asked separately this year. Accommodation Tour 61 35 0 0 3 41 47 9 0 3 45 44 11 0 0 Refreshments 47 36 8 5 5 42 39 12 3 3 41 40 14 2 3 Disabled Access/Facilities 23 62 15 0 0 40 60 0 0 0 50 50 0 0 0 6. Rating School/Course Tours Very Very Comments Good Average Poor good Poor School of Computing, Informatics and Media 67 0 33 0 0 School of Engineering, Design and Technology 100 0 0 0 0 School of Management 100 0 0 0 0 School of Social and International Studies 85 7.5 0 7.5 0 Delivery was poor and presentation failed. The tour was not good as the ambassadors couldn’t get into most of the rooms, this disadvantaged us to looking at useful equipment used in health studies. School of Health Studies School of Life Sciences 64 24 6 3 3 71 21 4 0 4 Tour was poorly planned; Not given enough time to explore alone or look at facilities, felt very rushed and did not get a proper feel for the university. The talk I attended was quite vague and did not go into enough detail as the other university open days did. A lot of info was not given. No activities or opportunities for participation. 7. Impressions after visiting 67.1% of respondents had visited other Open days and felt that in comparison the university of Bradford was either much better (27.1%), better (28.8%), remained the same (30.5%), worse (11.9%) or much worse (1.7%) 8. Likelihood to apply after visiting then Open Day: 90.3% of respondents were more likely to apply to the University of Bradford after visiting the Open Day (92.7% in October 2011). 9. Opinion of the University: 80.8% of respondent’s opinion of the university had also improved for the better (81.7% in October). However it had got worse (5.5%) for a very small percentage (2.4% in October 2011). Has your opinion of the UNIVERSITY changed during your visit July 2012 Oct 2011 July 2011 Much better: 35.6 39.0 50.0% Better: 45.2 42.7 30.0% The same: 13.7 15.9 17.1% Worse: 5.5 1.2 2.9% Much Worse: 0 1.2 0.0% 10. Opinion of the city The opinion of the city had also improved for 38.1% (37.4% in October 2011) of respondents though for 59.2% it had remained the same. Has your opinion of the CITY changed during your visit July 2012 Oct 2011 July 2011 Much better: 11.3 16.2 14.5% Better: 26.8 21.2 20.3% The same: 59.2 52.5 52.2% Worse: 1.4 8.8 11.6% Much Worse: 1.4 1.2 1.4% Proposals and Recommendations for the future – tbc by Helen, Kate and Claire
