SUPPLEMENTARY MATERIAL: Notes to the instructor
advertisement
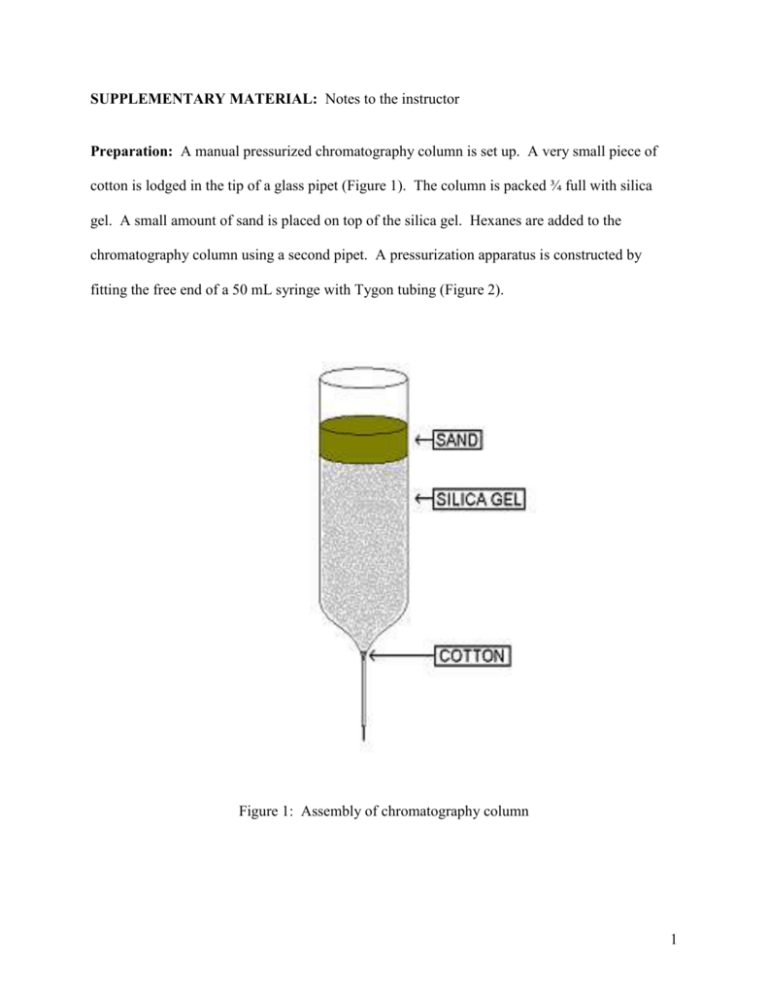
SUPPLEMENTARY MATERIAL: Notes to the instructor Preparation: A manual pressurized chromatography column is set up. A very small piece of cotton is lodged in the tip of a glass pipet (Figure 1). The column is packed ¾ full with silica gel. A small amount of sand is placed on top of the silica gel. Hexanes are added to the chromatography column using a second pipet. A pressurization apparatus is constructed by fitting the free end of a 50 mL syringe with Tygon tubing (Figure 2). Figure 1: Assembly of chromatography column 1 The plunger of the syringe is drawn out and the free end of the tygon tubing on the pressurization apparatus is fitted to the top of the chromatography column. Once attached, the plunger of the syringe is depressed until the hexanes drip out of the bottom of the column. The hexanes are collected in a clean test tube. Additional hexanes are added as necessary to completely wet the silica gel (Figure 2, right). Figure 2: Attachment of pressurization apparatus to chromatography column. Presentation / Procedure Procedure A: A green, red, blue or yellow lightstick is activated by bending the lightstick to break the inner glass ampoule. The lightstick is shaken vigorously to thoroughly mix the contents. The top of the lightstick is cut off with a pair of sharp scissors. Using a glass pipet, the glowing contents of the lightstick are transferred to the chromatography column (Figure 3). The free end of the tygon tubing on the pressurization apparatus is connected to the top of the chromatography column. The plunger on the end of the syringe is depressed, pushing the glowing contents of the 2 Figure 3: Addition of lightstick mixture to chromatography column. lightstick mixture through the column. When all of the glowing liquid has been pushed to a level equal to or below the sand in the chromatography column, the tygon tubing is detached from the chromatography column and more hexanes are added. Hexanes are added as necessary, and are pushed through the chromatography column using the pressurization apparatus (Figure 4). The liquid that is eluted from the column is collected in a clean test tube. Figure 4: Addition of hexanes as fresh eluent to the column. 3 It is observed that the lightstick mixture continues to glow quite well at the top of the column. However, as the components of the lightstick become separated (phenyl oxalate A B Figure 5: (A) Observation of the fluorescent dye when emitting (top of column) and not emitting (below green emitting band) light. (B) Collection of eluate (colorless) and fluorescent dye eluate (yellow). and a fluorescent dye are separated from H2O2 and salicylate ion) the emission ceases. When this occurs, the color of the fluorescent dye when it is not undergoing chemiluminescence is easily observed (Figure 5A). As more hexanes are passed through the column, the eluate containing fluorescent dye is collected in a clean, dry test tube. Because light is not emitted from the contents of the eluate, it is noted that the chemiluminescent reaction is not taking place therein (Figure 5B; Figure 6A). Once this is confirmed, a small volume of 3% H2O2 solution is added to the dye eluate, and a faint glow is observed (Figure 6B). Next, a few crystals of sodium salicylate are added to the faintly glowing mixture and the glow intensifies considerably (Figure 6C). 4 A B C Figure 6: Fluorescent dye eluted from column and treated as described in Procedure A. (A) Fluorescent dye eluate (tube on left) and contents removed from an activated, green lightstick (tube on right) under room lights. (B) Fluorescent dye eluate to which 1 mL of 3% H2O2 has been added in darkness. (C) Fluorescent dye eluate to which 1 mL of 3% H2O2 and a few crystals of sodium salicylate have been added (tube on left), and contents removed from an activated, green lightstick (tube on right) in darkness. Procedure B: A pink-to-blue color changing lightstick is activated. The contents of the lightstick are transferred to a chromatography column as described in Procedure A. The pressurization apparatus is used to push the glowing liquid mixture to a level that is equal to or below the level of the sand in the chromatography column. The tygon tubing of the pressurization apparatus is removed from the chromatography column. Two glowing bands of different color are observed on the chromatography column, due to the chromatographic separation of two different fluorescent dyes used in the color changing lightstick (Figure 7). A glowing pink band is observed near the top of the column, while a glowing blue band is observed slightly below. It is noted that, due to the observed positions of each dye on the polar column, the fluorescent dye responsible for the pink emission is more polar than the fluorescent dye emitting blue light (Figure 7A). 5 A B Figure 7: Separation of red- and blue-emitting fluorescent dyes from the contents of an activated lightstick on a silica gel chromatography column with hexanes as the mobile phase. (A) Separation of less polar, blue-emitting dye below a band of more polar, red-emitting dye viewed in darkness. (B) Photograph under room lights showing band of (non-emitting) yellow dye. This yellow dye is responsible for blue emission when in the presence of phenyl oxalate, H2O2 and salicylate ion. After several more volumes of hexanes are added to and pushed through the column using the pressurization apparatus, it is noticed (under room lights) that some of the blue-emitting dye is no longer glowing. This dye appears yellow when it is not emitting light (Figure 7B). The relationship between the color of this dye when it is, and is not, fluorescing may be discussed. In contrast to the band of blue-emitting dye that is no longer glowing, near the top of the column, the pink-emitting dye and a portion of the blue-emitting dye continue to glow. This is because the pink-emitting dye and a fraction of the blue-emittting dye have not been separated from H2O2 and salicylate ion. More hexanes are added to the column, and eluate containing the yellow dye is collected in a clean test tube. To this eluted dye, 3% H2O2 and crystals of sodium salicylate are added. The chemiluminescent reaction is restored, but because the eluted liquid only contains the non-polar yellow dye, and not the hydrophilic, pink emitting dye, the observed chemiluminescence is blue (Figure 8). 6 Figure 8: Comparison, in darkness, of light emission from fluorescent dye eluted from column and treated as described in Procedure B (tubes on left) with that of the leftover contents from the lightstick that were not passed through the column (right). 7 SUPPLEMENTARY MATERIAL: Lab documentation for Natural Science 200, a course for elementary education majors. Also used in chemistry camp. Introduction: The glow from a light stick is the result of a chemical reaction between an organic compound and hydrogen peroxide. A catalyst called sodium salicylate is also added to make the reaction go faster. This makes the lightstick brighter! The organic compound in light sticks is non-polar, but the hydrogen peroxide and sodium salicylate are polar. The organic compound and the hydrogen peroxide must be mixed in order for the chemical reaction to take place, giving the light. This is why you “snap” a light stick in order to get the glow started. When you “snap” a light stick, you are breaking a small container filled with hydrogen peroxide that is separated from the organic compound. When the container is broken, the hydrogen peroxide and the organic compound mix, causing a glowing chemical reaction. In this experiment, you will use chromatography to separate the polar hydrogen peroxide and sodium salicylate from the organic compound from glowing light stick liquid. This will cause the light stick liquid to stop glowing. When you add the hydrogen peroxide back to the organic compound (which no longer glows without the hydrogen peroxide), the mixture begins to glow again! When you add the sodium salicylate back, the glow becomes more intense. Materials: Light sticks (blue or red works the best), scissors, silica gel, small glass pipets, cotton, sand, hexane, 50 mL syringe fitted with tygon tubing, test tubes. Procedure: 1. Place a very small piece of cotton in the tip of a glass pipet (see Figure 1). Figure 1: Assembly of Glowstick chromatography column 8 2. Add silica gel to the pipet so that it is ¾ full with silica gel (see Figure 1). 3. Place a small amount of sand on top of the silica gel (see Figure 1). You have now assembled your chromatography column. 4. Using a pipet, add hexane to the chromatography column. 5. Attach the free end of the tygon tubing from the 50 mL syringe fitted with tygon tubing to the top of the chromatography column. Be sure that the plunger of the syringe is drawn out. 6. Push on the plunger of the syringe until the hexane drips out the bottom of the column. Collect the hexane in a clean test tube. 7. Repeat steps 4 – 6 until the silica gel in the chromatography column is completely wet. 8. Add hexane to the chromatography column until it rests just on top of the sand. 9. “Snap” the contents of the light stick to get it glowing. 10. With your instructors help, cut off the top of the light stick to expose the glowing contents of the light stick. 11. Using a glass pipet, transfer some of the glowing contents of the light stick to the chromatography column. 12. Attach the free end of the tygon tubing from the 50 mL syringe fitted with tygon tubing to the top of the chromatography column. Be sure that the plunger of the syringe is drawn out. 13. Push on the plunger of the syringe until liquid drips out the bottom of the column. You may notice that the liquid stops glowing as it travels through the chromatography column. This is because the column removes hydrogen peroxide from the light stick mixture, which stops the glow! Collect liquid in a clean test tube. Discard. 14. Repeat steps 11-13 a number of times, but this time save liquid that drips out of the column. 15. Take the liquid you saved in step 14 into a darkened room. Does the liquid glow? 16. Using a glass pipet, add a small amount of 3% hydrogen peroxide to the liquid you saved in step 14. Does the liquid glow now? 17. Now add a few crystals of sodium salicylate to the liquid you saved in step 14. Does the liquid glow more brightly? Questions: 1. What components are necessary for the light stick mixture to glow brightly? 2. What substance(s) did the chromatography column remove from the light stick mixture? 3. Did the light stick mixture continue to glow as it traveled through the chromatography column? Why or why not? 4. What did you add to the portion of the light stick mixture that traveled completely through the column? Did this cause the mixture to glow again? Why or why not? 9 SUPPLEMENTARY MATERIAL: Lab documentation for Physical Chemistry Laboratory Electronic Absorption and Emission Spectra of Dyes in Lightsticks Introduction to Absorption and Emission Spectroscopy: The energy necessary to cause a change in the electronic structure of a molecule normally falls within the visible or ultraviolet region of the electromagnetic spectrum. Therefore, when photons of ultraviolet or visible light are absorbed by a molecule in its ground electronic state, the molecule is promoted to an excited electronic state (Figure 1, left). Conversely, a molecule in an excited electronic state may emit a visible or UV photon, relaxing the molecule to its ground electronic state (Figure 1, right). If the photon is released from an excited state of the same spin as the ground state (as is most often the case), the observed emission is called fluorescence. Figure 1: Representation of electronic absorption (left) and emission (right). The ground (lower) and excited (upper) states are represented by potential wells for anharmonic oscillators. Absorptions usually originate from the ground vibrational level of the ground electronic state. This is because at room temperature, essentially all molecules exist in the vground = 0 vibrational state of the ground electronic state1. Notice that all absorptions (Figure 1, left) display this situation by showing all absorptions originating from the vground = 0 electronic state. During absorption of a photon, the excited state molecule may simultaneously be promoted to an upper vibrational state2. The lowest energy (longest wavelength) transition in absorption spectroscopy therefore occurs when a molecule is promoted to an excited state with no accompanying promotion to upper vibrational levels of the excited state. This transition is often recognized as ~0 , 0 (Figure 1, left, arrow in bold). Emissions also usually originate from the ground vibrational level of the excited electronic state. When molecules are excited to upper electronic states, they usually acquire enough energy to access higher vibrational levels within the excited state. This excess vibrational energy is usually lost quickly through processes that do not emit light (called vibrational relaxation), such as transfer of this vibrational energy to nearby solvent molecules. Thus, once a molecule is excited, it quickly relaxes to the ground vibrational state, and fluorescence generally occurs from 10 the vexcited = 0 state of the upper electronic state. However, when an excited state molecule emits a photon, the molecule may relax back to any of the vibrational levels of the ground state molecule. As a result, the highest energy (shortest wavelength) transition in a fluorescence spectrum occurs when the excited state molecule relaxes back to the ground state, vground = 0 level (Figure 1, right, arrow in bold). This emission line occurs at~0 , 0 . Therefore, the overall fluorescence spectrum of a particular molecule occurs at longer wavelengths than its overall absorption spectrum, with overlap close at~0 , 0 . It should be emphasized that excited electronic states of a molecule may be generated through chemical processes, in addition to the absorption of light. Chemiluminescence is the term used to describe chemically generated excited state species that fluoresce. If we assume that absorption and emission lines are Gaussian in nature, the six absorptions and six emission lines from Figure 1 could have the following form (Figure 2): Figure 2: Possible Gaussian distribution profiles of absorptions (solid) and emission (dashed) lines from Figure 1. Note that ~0 , 0 , which may involve absorption or emission, is a dotted line. l / nm The spacings between the maxima of the absorption peaks depend upon the differences in energy of vibrational levels in the excited state; the spacings between the maxima of the fluorescence peaks depend upon the differences in energy of vibrational levels in the ground state. Because the recorded emission spectrum will be the sum of all emissions and the recorded absorption spectrum will be the sum of all absorptions, the two spectra are roughly mirror images of one another that overlap close to ~0 , 0 (Figure 3, page following). 11 l / nm Figure 3: Expected absorption (solid line) and emission (dashed line) spectra from the absorption and emission lines from Figure 2. Introduction to the Chemistry of Lightsticks: The chemical constituents of a lightstick may be classified into broad groups: hydrophobic, non-polar organic compounds and hydrophilic, polar or ionic species. Common non-polar components include dibutyl phthalate (the solvent) and a phenyl oxalate. The hydrophilic species include H2O2 and sodium salicylate, which serves as a catalyst. To generate different color effects, a wide variety of fluorescent dyes are also contained in glowsticks, which vary in polarity. Usually, the fluorescent dyes and non-polar components are located in a glass ampoule in the center of a lightstick. This ampoule is encased within a plastic, outer tube. In addition to encasing the glass ampoule, the plastic tube also contains a mixture of H2O2 and sodium salicylate in dibutyl phthalate. To initiate the glowing reaction, the inner glass ampoule is broken and the two classes of compounds are mixed. Once mixed, the H2O2 oxidizes the phenyl oxalate to form phenol and a high energy CO2 dimer: O O O C C O + O O C C O O dye* + dye H 2O 2 OH 2 2 CO2 dye + + + O O C C O O dye* h Scheme 1: Proposed reaction sequence for the reaction between bis(phenyl) oxalate and H2O2 in the presence of a fluorescent dye to generate visible light. The first step of this reaction sequence is base catalyzed. 12 The CO2 dimer transfers energy to a fluorescent dye in the lightstick, and is concomitantly cleaved into 2 molecules of CO2. The energy gained by the dye promotes the dye molecule to an excited state, which undergoes vibrational relaxation before relaxing back to the ground state by the emission of light. The sodium salicylate functions to balance the pH of the lightstick mixture, ensuring that the steps of the chemiluminescent reaction sequence goes fast enough so that light emission is easily observed, but slow enough that the light is emitted for several hours. A color changing lightstick is studied in this experiment. A probable reaction sequence for the reactions occurring in the color changing lightstick is shown below (Scheme 2). A stable dye that emits blue light (dye1) and a “peroxide unstable” dye that emits pink-red light (dye2) are included in the color changing lightstick. At first, the lightstick is observed to emit a red-pink color, simply because much more red-pink light is emitted than blue. However because the reaction occurs in the presence of H2O2, dye2 is unstable in the reaction mixture and decomposes over time, leading to a more rapid decrease in fluorescence from this dye as compared to dye1. As a result, the color changing lightstick alters to a purple color at intermediate timescales, and finally to blue at long time scales when dye2 has been consumed. The blue fluorescer is less polar than the red fluorescer, and therefore these dyes can be separated chromatographically. O O O C C O + O O C C O O k2 + dye 1 dye1 * O O C C O O H 2O 2 k3 dye2 * k5 k6 dye2 OH 2 2 CO2 dye1 + k4 + dye 2 k1 dye1 * h (blue) 2 CO2 dye2 + + + O O C C O O + dye2 * h (pink-red) non fluorescing products Scheme 2: Proposed reaction sequence for the reactions occurring within a pink-to-blue color changing lightstick. In this experiment, you will chromatographically separate the non-polar phenyl oxalate and nonpolar fluorescent dye from the polar H2O2 and sodium salicylate in a green lightstick mixture. You will then measure the absorption and emission spectra of this green emitting dye. In addition, you will compare the emission spectra of the green emitting dye generated by UV light and by chemiluminescence. You will then repeat this process using a color changing lightstick. 13 Procedure: Part 1: Separation of the green-emitting dye from a green changing lightstick 1. Pack a small glass pipette with silica gel (USE THE HOOD). Remember to place a small plug of cotton in the bottom of the pipette! Place a small layer of sand on the top of the column. 2. Wet the column with hexanes. Use a syringe fitted with Tygon tubing (hereafter called the pressurization apparatus) to push the hexanes through the column. 3. Activate the green lightstick. Collect and record the chemiluminescent fluorescence spectrum of the lightstick. 4. Using a sharp pair of scissors, cut the lightstick open. Using a pipette, transfer some of the glowing contents of the lightstick onto the column. Using the pressurization apparatus, push the contents into the column so that the glowing contents are even with the sand. 5. Chase the lightstick contents with hexanes: Using a pipette, transfer some hexanes onto the column. Use the pressurization apparatus to push the lightstick components through the column. Continue to add hexane in order to elute the green emitting dye. The identity of this dye is most likely 9,10-bis(phenylethnyl)anthracene (hereafter identified as BPEA). Note that BPEA appears yellow when it is not glowing. 6. Collect the BPEA in a clean test tube. You should recognize that this dye has not been separated from the phenyl oxalate originally in the lightstick. This is because the phenyl oxalate is non-polar. 7. Separate the collected eluate that contains the phenyl oxalate and BPEA into three clean test tubes. Part 2: Collection of the emission spectrum of a pink-to-blue color changing lightstick 1. Obtain a pink-to-blue color changing lightstick. Activate the lightstick. Record the time you activated the lightstick as time t = 0. 2. Record the chemiluminescent fluorescence spectrum of the lightstick at a time as close to t = 0 as possible. 3. Record the fluorescence spectrum of the lightstick at 1, 2, 3, 4, 6, 8 and 10 minutes. Part 3: Separation of the blue-emitting dye from a pink-to-blue color changing lightstick 1. Obtain a pink-to-blue color changing lightstick. 2. Using the procedure described in part 2, collect the blue-emitting dye. You will notice that this dye separates from a red dye on the column and that this blue-emitting dye appears yellow-peach in color when it is not emitting. The identity of the dye collected from this lightstick is most likely 9,10-bis(4-methoxyphenyl)-2-chloro-anthracene (hereafter identified as BMPCA). You should recognize that this dye has not been separated from the phenyl oxalate originally in the lightstick. 3. Separate the eluate containing BMPCA and phenyl oxalate into three test tubes. 14 Part 4: Recording the emission and absorption spectra of the lightstick dyes 1. Using the contents of one of the test tubes from step 8 of Part 1, record the absorption spectrum of BPEA. 2. Using the contents of one of the test tubes from step 3 of Part 3, record the absorption spectrum of BMPCA. 3. Shine a long-wave UV light source on the contents of one of the test tubes from step 8 of Part 1. Record the resulting fluorescence spectrum. 4. Shine a long-wave UV light source on the contents of one of the test tubes from step 3 of Part 3. Record the resulting fluorescence spectrum. 5. To the contents of the final test tube from step 8 of Part 1, add 1 mL of 3% H2O2. Record the chemiluminescent emission spectrum of the sample. 6. To the contents of the test tube to which you just added 3% H2O2, add 5 mg of sodium salicylate. Record the chemiluminescent emission spectrum of the sample. 7. To the contents of the final test tube from step 3 of Part 3, add 1 mL of 3% H2O2 and 5 mg of sodium salicylate. Record the chemiluminescent emission spectrum of the sample. Data Analysis: 1. Prepare an overlay plot of the time-dependent chemiluminescent emission spectra obtained in Part 2. 2. Prepare an overlay plot of the fluorescence spectrum and chemiluminescent emission spectrum of BMPCA. Scale the spectra so that their maximum emissions coincide. 3. Prepare an overlay plot of the fluorescence spectrum and chemiluminescent emission spectrum of BPEA. Scale the spectra so that their maximum emissions coincide. 4. Prepare an overlay plot of the emission and absorption spectra of BPEA. Scale the plots so that the intensity of lmax, emission equals the intensity of lmax, absorption. 5. Prepare an overlay plot of the emission recorded from a green lightstick, BPEA eluate + H2O2 and BPEA eluate + H2O2 and sodium salicylate. Questions: 1. Using the plots prepared in parts 1 and 2 of the Data Analysis section, account for the color change observed in a pink-to-blue color changing lightstick. 2. Account for the presence of lines observed in the UV induced emission spectrum of BMPCA that are not present in the chemiluminescent emission spectrum of BMPCA. 3. Use the overlay absorption/emission plot of BPEA to estimate~0 , 0 for this dye. 4. Why was it necessary to add H2O2 and salicylate, but not phenyl oxalate to the eluate collected in step 8 of Part 2 and step 3 of Part 3 in order to observe chemiluminescence? 5. Explain why BPEA appears yellow when it is not emitting light, but green when it is emitting light. HINT: Remember your color wheel from General Chemistry. 6. Compare the emission from a green lightstick to that of the BPEA eluate that had been reactivated with H2O2 and sodium salicylate. Why do you observe differences in these spectra? 15 Footnotes: 1. There are exceptions to this rule. Some molecules, such as I2, have appreciable populations in the v = 1 and v = 2 states at room temperature. 2. It should be noted that every vibrational state also has associated rotational quantum states. The separation between rotational levels is quite small with respect to the separation between vibrational levels; therefore a discussion of the rotational levels has been omitted for clarity. 16


