Last-rev-Y12
advertisement
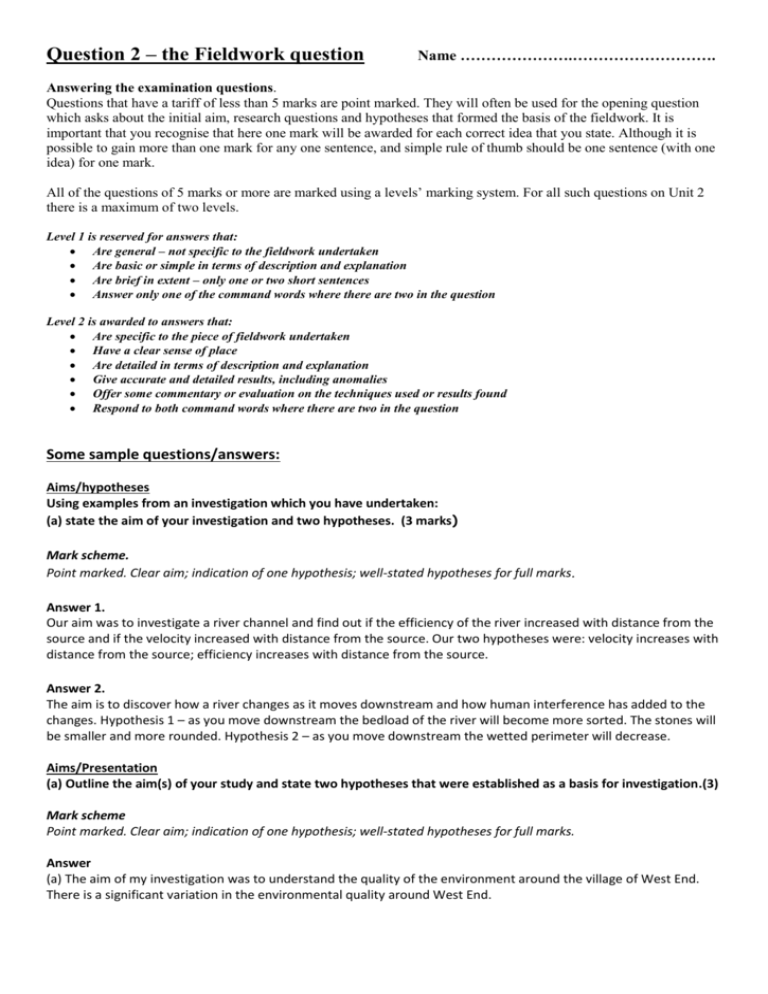
Question 2 – the Fieldwork question Name ………………….………………………. Answering the examination questions. Questions that have a tariff of less than 5 marks are point marked. They will often be used for the opening question which asks about the initial aim, research questions and hypotheses that formed the basis of the fieldwork. It is important that you recognise that here one mark will be awarded for each correct idea that you state. Although it is possible to gain more than one mark for any one sentence, and simple rule of thumb should be one sentence (with one idea) for one mark. All of the questions of 5 marks or more are marked using a levels’ marking system. For all such questions on Unit 2 there is a maximum of two levels. Level 1 is reserved for answers that: Are general – not specific to the fieldwork undertaken Are basic or simple in terms of description and explanation Are brief in extent – only one or two short sentences Answer only one of the command words where there are two in the question Level 2 is awarded to answers that: Are specific to the piece of fieldwork undertaken Have a clear sense of place Are detailed in terms of description and explanation Give accurate and detailed results, including anomalies Offer some commentary or evaluation on the techniques used or results found Respond to both command words where there are two in the question Some sample questions/answers: Aims/hypotheses Using examples from an investigation which you have undertaken: (a) state the aim of your investigation and two hypotheses. (3 marks) Mark scheme. Point marked. Clear aim; indication of one hypothesis; well-stated hypotheses for full marks. Answer 1. Our aim was to investigate a river channel and find out if the efficiency of the river increased with distance from the source and if the velocity increased with distance from the source. Our two hypotheses were: velocity increases with distance from the source; efficiency increases with distance from the source. Answer 2. The aim is to discover how a river changes as it moves downstream and how human interference has added to the changes. Hypothesis 1 – as you move downstream the bedload of the river will become more sorted. The stones will be smaller and more rounded. Hypothesis 2 – as you move downstream the wetted perimeter will decrease. Aims/Presentation (a) Outline the aim(s) of your study and state two hypotheses that were established as a basis for investigation.(3) Mark scheme Point marked. Clear aim; indication of one hypothesis; well-stated hypotheses for full marks. Answer (a) The aim of my investigation was to understand the quality of the environment around the village of West End. There is a significant variation in the environmental quality around West End. (b) Describe a method of presentation you used in your investigation and say how the method was useful. (7) Mark scheme. Levels marked. Level 1 – Method described without reference to its usefulness. 1-4 Level 2 – Clear indication of method of presentation or developed reference to show how technique was useful. Some indication as to why method was chosen – expands on useful. 5-7 Answer one My chosen method of presentation was spider graphs. I started off by drawing the axes for my graph because as I had 16 EQ things I required 16 different spokes. I then labelled each one with whatever I was surveying eg noise, litter, air quality. I then numbered the spikes beginning with 0 on the inside moving to 10 on the outside. I was then able to plot my data on it. I could also using a key plot more than one location on it. This is one advantage because you can easily compare the different locations. Being very visual it is easy to spot trends and especially for my investigation where I wanted to see variation in locations. This method however is very time consuming and can get confusing if too many locations are plotted on one graph. Answer two To collect our data we measured the cross section of the river at one mile intervals along the river from the source to the mouth. We had a metre ruler with cm and mm on it and at each point (1 mile) we measured the depth of the river at 20cm intervals. We wrote down our results in a table. We did this along the whole river. We got back to the classroom and the measurements we took allowed us to draw a cross-section of the river. On squared paper we drew the channel to scale joining the points up to get the river bed. We then had a visual representation of the river at 1 mile intervals which allowed us to observe the changes in depth and width. It was also useful in that because the drawings were to scale you could measure the efficiency of the river by doing the cross sectional area divided by the wetted perimeter to help us find if our hypothesis was correct. Aims/hypotheses/Analysis: (a) Outline the aim(s) of your investigation and state two hypotheses that were established as a basis of the investigation. (3 marks) Mark scheme Point marked. Clear aim; indication of one hypothesis; well-stated hypotheses for full marks. Answer I hypothesised that in Sheffield the wealthier people would have the better quality of environment and that the more deprived areas would be closer to the CBD. My aim was to discover if there was a segregation of wealth in Sheffield. (b) Describe a method of data analysis that was used and state the advantages of using that method. (7 ) Mark scheme Level 1 – method described in general terms without reference or link to analysis of data. 1-4 Level 2 – clear indication as to method of data analysis and developed reference to suggest the advantages of the method. 5-7 I used Spearman’s Rank because it gave me a figure upon which I could test my results. I completed this by ranking all the wards in Sheffield (29 of them) based on house prices. Then I ranked them based on the index of deprivation. The better they were the lower the score ie the best was 1, the worst was 29. I then found out the difference between the rank of index of deprivation and house prices. I then squared the differences and added up the total of all 29 differences squared. I then used the formula (correct one given) to discover the correlation. The answer was 0.89 which shows a strong positive relationship because the scale goes from -1 to +1 with -1 being a poor correlation and 1 being a strong correlation. Fieldwork plan Stage AIM Points to consider What was the aim of the study? What were you trying to find out? What was the underpinning theory/idea/concept? (whose ideas/theories) HYPOTHESES What hypotheses were tested? Which variable can be correlated against each other or in relation to some other variable such as distance downstream, or size/shape of stone DATA COLLECTION What methods were used to collect data for each of your hypotheses? Why were they the best? Justify them. What equipment was required to carry out the investigation? What were the risks associated, and how did you respond to them? DATA PRESENTATION What method(s) would be suitable to test relationships between the variables being tested? Why is this method suitable? Illustrate this technique. Can you describe it to someone EXACTLY DATA ANALYSIS What method(s) could be applied to analyse the data? Is there any correlation between the variables? What are the advantages of using this method? Can you quote some actual speed results. What did you learn? Were there any anomalous results? What/how did it contribute to your understanding? How could it be useful to others? RESULTS IMPROVEMENTS Answers/ comments What could you do to improve it? (Every section including sampling) Draw an annotated sketch map of the location of your study area to show its basic characteristics. (5 marks) Diagram of the technique/s you used to present/analyse your data. (5) Distinguish between quantitative and qualitative sources of data in your fieldwork enquiry. (3 marks) How was ICT used in your fieldwork? (5 marks)
